After an upside inflation surprise in October, it’s clear that peak inflation may still be ahead, possibly even pushing into 2022. While the Federal Reserve (Fed) maintains its position that elevated inflation will be transitory, we have yet to see progress. Below we look at five signs to watch for over the next several months that may signal that inflation may be near or at its peak. The October reading for the Consumer Price Index (CPI), the most widely known measure of inflation, came with an upside surprise versus expectations on top of already elevated inflation concerns. The headline number came in at 0.9% for the month and 6.2% for the year, the highest reading since November 1990. The core reading (which excludes food and energy prices) rose 0.6% for the month and 4.6% for the year—the highest since August 1991. Elevated inflation continues to be largely driven by pandemic-related dynamics—primarily supply chain challenges and tight labor markets combined with high demand as the global economy bounces back. The COVID-19 Delta variant has deepened those problems in unexpected ways, although we cautioned in the early days of the surge that further supply chain disruptions were likely. Calling inflation “transitory” has not really captured these inflation dynamics well. Elevated inflation will last as long as supply chain bottlenecks and hiring challenges remain in place. As those dynamics subside, we expect inflation to return to something close to 2%, but we believe that’s more of a 2023 conversation. But market participants don’t need to wait until CPI is back under 3% to feel a sense of relief. It would be enough to know that we’re past the peak, something that might not happen until 2022. In fact, since markets are forward looking, it may be enough to have a “peek at the peak.” Here are five signs to watch for that peak inflation, if not immediately at hand, may be in the near future.
Supply Chains
Current inflationary pressure is primarily about supply chain disruptions, the inability to get product to market (whether because of labor and material shortages), the inability to maintain needed inventory, or logistical disruptions. Supply chains will heal over time—businesses have a strong profit incentive to address supply chain challenges. But there are structural constraints on how quickly progress takes place that businesses can’t control. To take one high profile anecdotal example of supply chain disruptions and the impact of structural problems, there are currently over 100 container ships waiting to unload off the ports of Los Angeles and Long Beach, California. Before the pandemic, the worst backup was under 20. But the needed equipment, space, workers to accelerate progress simply isn’t available on demand. Our best peek at how supply chains are doing may be purchasing managers’ index (PMI) readings. Supply-chain related readings from the Institute for Supply Management’s October release has shown some improvement in places, but disruptions remain elevated. The reading on order backlogs peaked in May, but at 63.6 remains well above its long-term median of just above 50 (above 50 indicates higher backlogs from the previous month). Likewise, supplier deliveries also peaked in May but has moved higher the last two months and was at a very elevated 75.6 in October. Readings in the mid to low 50s for both of these sub-indexes would probably be needed to indicate we were on the cusp of significant improvement to supply chain problems.
Housing and Rents
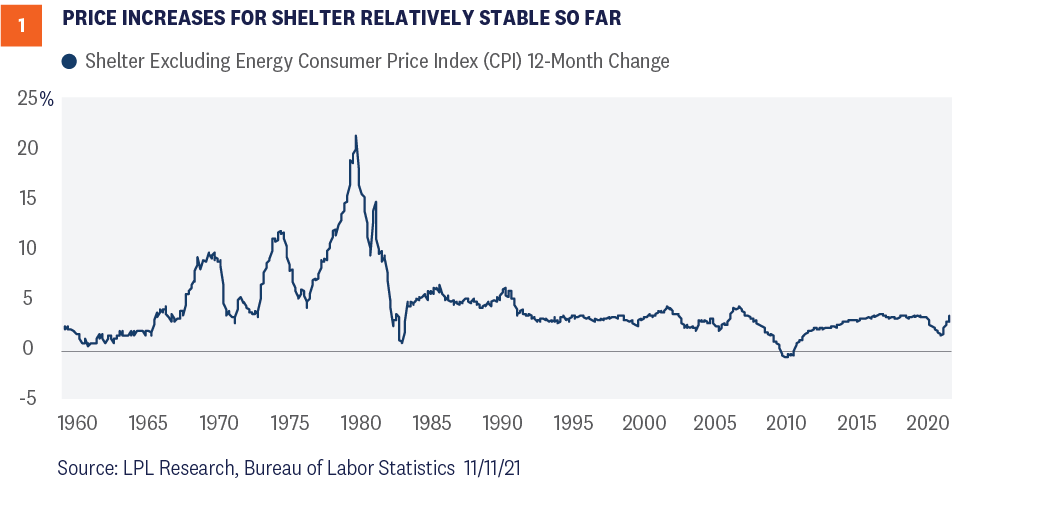
Shelter excluding energy costs, essentially housing costs and rents, makes up about 1/3 of CPI and just over 40% of core CPI (excluding food and energy). Costs for housing have picked up on a year-over-year basis but, unlike some other measures of inflation, it has not yet hit a high dating back to the 1990s [Figure 1]. In fact, current one-year housing inflation, at 3.5%, is lower than its 2019 peak. Nevertheless, housing costs have jumped the last three months and housing inflation is a concern—both because it represents such a high proportion of consumer spending and because it tends to be relatively sticky. Base effects (rolling low numbers off the one-year reading) will likely help push annual shelter inflation higher until April 2022, so looking at monthly numbers will be important. Consecutive monthly readings near 0.3% would be a good sign that housing costs have stabilized but, even at that level, the year-over-year number could continue to climb in the first several months of 2022.
Market Implied Inflation
Breakeven inflation rates, the difference between nominal Treasury yields (the number we usually hear about) and the yield for Treasury Inflation-Protected Securities (TIPS), can provide important information about inflation expectations. The breakeven inflation rate is the forward-looking reading of inflation at which TIPS would outperform similar maturity nominal Treasuries if inflation were to run higher. Because investors are willing to pay extra for a hedge against inflation, the breakeven rate tends to run higher than what true expectations may actually be. The two-year breakeven began to climb in early October 2021 after holding roughly steady since early February, and currently sits around 3.3%. The Bloomberg-surveyed economists’ consensus for average inflation in 2022-2023 is 2.8%. Since higher near-term inflation expectations will roll off as we approach peak, a return of the two-year breakeven to around 2.75% would probably indicate we have passed the peak and a decline to below 3% could be an early signal the peak is coming.
Energy and Commodity Prices
Even though energy prices are volatile compared to overall price levels, for most people prices at the pump shape their perception of inflation more than anything else. Oil prices (West Texas Intermediate) have been climbing since October 2020 and now sit above $80 per barrel compared to a level that generally hovered closer to $60 for much of 2019. Global copper prices started climbing even earlier, beginning their advance in May 2020. Both oil and copper prices can stay elevated for some time and it’s not as easy to target a particular signal that inflation may be settling down. Copper has already shown some stabilization since peaking in May and while base effects will be in play until April 2022, stability around current levels until the end of the year (or any sharp decline) would be a good signal inflation may soon peak. The picture on oil isn’t as clear. Oil maintained a range above current levels from 2011 to 2014, but CPI was still running under 2% for much of that period. If oil were to hover near $80 barrel into early 2022 with no significant advance, it would be a positive sign that inflation may be peaking, but we wouldn’t take it as a negative sign if it pressed higher.
Consumer Sentiment
Influenced by prices at the pump, consumer inflation expectations have skyrocketed. While not the best predictor of inflation, inflation expectations can have an effect on actual inflation and is monitored by the Fed. The Conference Board’s survey of consumer inflation expectations twelve months from now climbed to 7% in October. The New York Federal Reserve Bank’s consumer survey has also seen expectations spike, but to a more moderate (but still very elevated) 5.65% in October. Both of these numbers are well outside of norms. For consumer expectations, just seeing the numbers begin to settle down would be enough to signal we were potentially near the peak. The Conference Board’s survey has a longer history, and typically spikes in expectations have been short lived. Current expectations have been over 6% for the last 11 months, with the most recent reading the highest. Expectations moving back below 6% would be an important signal we may be near or at the peak.
Conclusion
For market participants, the main inflation takeaway is how it might influence the Fed’s timeline for starting rate hikes. When evaluating that, we believe it’s important to factor in the Fed’s understanding of how a rate hike would impact the kind of inflation we’re dealing with. A rate hike usually helps to control inflation by slowing demand when an economy is overheating. But it can’t help ships unload containers more quickly or help address order backlogs. We still see the first rate hike likely coming in early 2023, especially if there are strong signals inflation has peaked. But if rising housing costs and consumer expectations make higher inflation stickier, we could see the first rate hike pulled into 2022. Whichever way it goes, you’ll know some of the key signals to watch for. Barry Gilbert, PhD, CFA, Asset Allocation Strategist, LPL Financial
George Henry Smith, CFA, CAIA, CIPM Senior Analyst, LPL Financial ______________________________________________________________________________________________ IMPORTANT DISCLOSURES This material is for general information only and is not intended to provide specific advice or recommendations for any individual. There is no assurance that the views or strategies discussed are suitable for all investors or will yield positive outcomes. Investing involves risks including possible loss of principal. Any economic forecasts set forth may not develop as predicted and are subject to change. References to markets, asset classes, and sectors are generally regarding the corresponding market index. Indexes are unmanaged statistical composites and cannot be invested into directly. Index performance is not indicative of the performance of any investment and does not reflect fees, expenses, or sales charges. All performance referenced is historical and is no guarantee of future results. Any company names noted herein are for educational purposes only and not an indication of trading intent or a solicitation of their products or services. LPL Financial doesn’t provide research on individual equities. All information is believed to be from reliable sources; however, LPL Financial makes no representation as to its completeness or accuracy. U.S. Treasuries may be considered “safe haven” investments but do carry some degree of risk including interest rate, credit, and market risk. Bonds are subject to market and interest rate risk if sold prior to maturity. Bond values will decline as interest rates rise and bonds are subject to availability and change in price. The Standard & Poor’s 500 Index (S&P500) is a capitalization-weighted index of 500 stocks designed to measure performance of the broad domestic economy through changes in the aggregate market value of 500 stocks representing all major industries. The PE ratio (price-to-earnings ratio) is a measure of the price paid for a share relative to the annual net income or profit earned by the firm per share. It is a financial ratio used for valuation: a higher PE ratio means that investors are paying more for each unit of net income, so the stock is more expensive compared to one with lower PE ratio. Earnings per share (EPS) is the portion of a company’s profit allocated to each outstanding share of common stock. EPS serves as an indicator of a company’s profitability. Earnings per share is generally considered to be the single most important variable in determining a share’s price. It is also a major component used to calculate the price-to-earnings valuation ratio. All index data from FactSet. Please read the full Outlook 2021: Powering Forward publication for additional description and disclosure. This research material has been prepared by LPL Financial LLC. Securities and advisory services offered through LPL Financial (LPL), a registered investment advisor and broker-dealer (member FINRA/SIPC). Insurance products are offered through LPL or its licensed affiliates. To the extent you are receiving investment advice from a separately registered independent investment advisor that is not an LPL affiliate, please note LPL makes no representation with respect to such entity. Not Insured by FDIC/NCUA or Any Other Government Agency | Not Bank/Credit Union Guaranteed | Not Bank/Credit Union Deposits or Obligations | May Lose Value
RES-892982-0921 | For Public Use | Tracking # 1-05212142 (Exp. 11/22)
The S&P 500 Index has gained more than 20% so far this year, making more than 50 record highs along the way. Certainly nobody should be upset with that return if that was all 2021 brought us. However, we see signs that there could be more gains to come in the final two months of the year. Seasonal tailwinds, improving market internals, and clear signs of a peak in the Delta variant all provide potential fuel for equities heading into year-end, and we maintain our overweight equities recommendation as a result.
Late October is the Seasonal Low
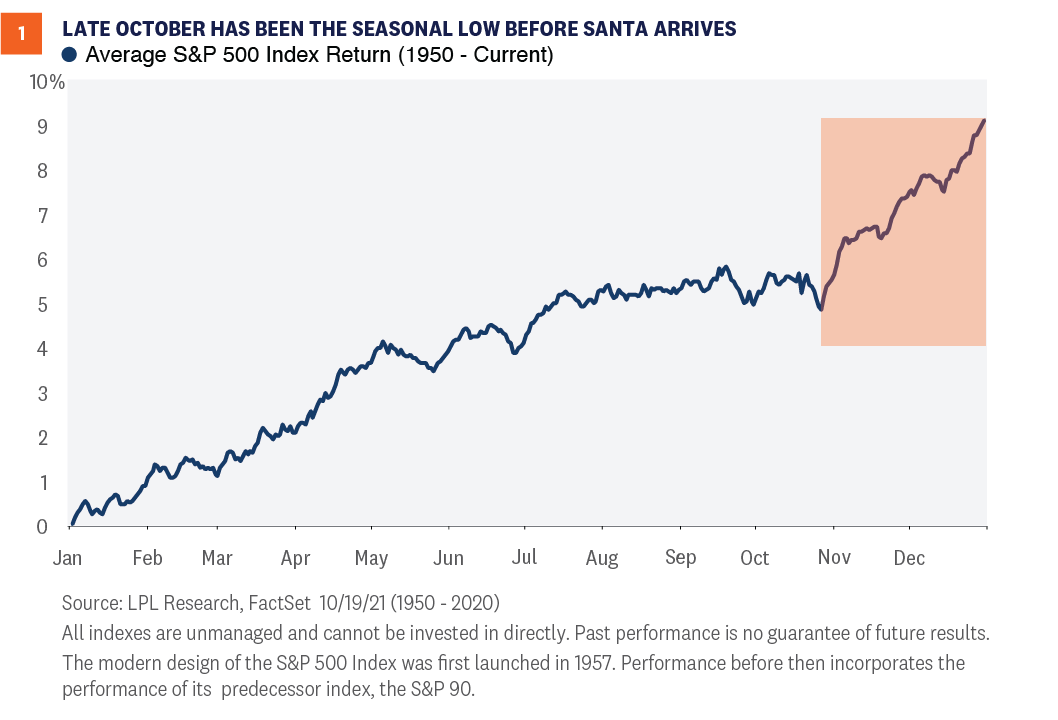
One of the most important points we believe investors should recognize is that there has been a sort of stealth correction going on throughout most of the summer, consistent with the historically weak period commonly referred to as “Sell in May and Go Away.” While the S&P 500 has returned more than 8% since the end of April, the average individual stock in the index suffered more than a 10% correction. Meanwhile, the average stock in the Russell 2000 Index (covering small cap equities), which is almost unchanged over that period, suffered a more than 25% bear market. However, as shown in [Figure 1], late October has historically marked the seasonal low before stocks typically rally into year-end. In fact, the fourth quarter as a whole is by far the strongest quarter historically, on average, with the S&P 500 rising 4% and finishing higher nearly 80% of the time. November, meanwhile, is the strongest month of the year—both since 1950 and over the past decade. So, whether you believe that stocks have thus far followed the historical pattern of summer weakness that should be ending, or that the current price trend is so strong that it was able to buck the summer doldrums, we see ample reason to believe that seasonality has now turned from a headwind for equities to a tailwind.
Improving Market Internals
Seasonality is something that we want to be aware of, but perhaps more important to our thesis is what technicals and market internals are showing us right now. As we just discussed, much of the market has corrected over recent months, but are key groups showing signs of improvement? The answer is clearly yes. Economically sensitive groups of stocks, commodities, and even bond yields had largely stagnated since early May—but have recently reaccelerated. For example:
The S&P 500 Financials Sector just broke out to a new all-time high after being largely unchanged from May 7 through October 13.
The Dow Jones Transportation Average is up more than 10% in October alone—and at a three-month high after suffering a 13% correction.
Copper, often referred to as Dr. Copper for its ability to forecast economic conditions, has gained more than 10% since bottoming in August.
The yield on the 10-year U.S. Treasury is up more than 50 basis points (0.50%) since its low in July.
Consumer discretionary stocks have outperformed consumer staples stocks by 10 percentage points in the past two months after lagging them for much of the summer.
There are certainly more examples, but let’s not forget perhaps the most important indicator: price. After finally suffering its first 5% pullback of 2021 in early October, the S&P 500 has come roaring back and closed at a record high on October 21. We firmly believe that new highs are something to be embraced, not feared, and history shows that new highs tend to come in bunches—something that has certainly been true so far this year.
Data Strong Amid Clear Signs of a Delta Peak
Though the above points may be construed as a technical argument for strength into year-end, make no mistake: The fundamentals are improving in real time as well. The rolling seven-day rate of new COVID-19 cases has fallen over 60% from its peak in early September. No doubt connected to the decrease in cases, jobless claims have fallen steadily in recent weeks, with continuing claims sliding below 2.5 million for the first time since the pandemic began. Recent economic data shows that Americans have taken notice of the improved outlook. Economists expected retail sales to fall slightly in September, but the report showed that overall retail sales grew 0.7%. Despite the impact of the COVID-19 Delta variant wave, retail sales have grown three of the past four months, providing further evidence of the strength of the U.S. consumer. Finally, the U.S. Bureau of Labor Statistics (BLS) latest Job Openings and Labor Turnover Survey (JOLTS) report showed that the number of American workers who are voluntarily quitting their jobs is at its highest rate since the BLS started publishing data in 2001. Typically, quits are viewed as a sign of a strong economy and healthy labor market, as the most common reason for people voluntarily leaving their job is to start a new one—something workers are more hesitant to do in times of economic uncertainty.
Conclusion
LPL Research continues to believe that tactical investors should tilt portfolios in favor of stocks over bonds relative to their respective targets. Modestly rising interest rates and tight credit spreads reflect a healthy and improving economy, but should add pressure to fixed income returns in the near-term. Meanwhile, a bullish part of the calendar, improving equity market internals, and falling COVID-19 cases may clear the way for a potentially bullish environment for equities through year-end. Ryan Detrick, CMT, Chief Market Strategist, LPL Financial
Scott Brown, CMT, Senior Analyst, LPL Financial ______________________________________________________________________________________________ IMPORTANT DISCLOSURES This material is for general information only and is not intended to provide specific advice or recommendations for any individual. There is no assurance that the views or strategies discussed are suitable for all investors or will yield positive outcomes. Investing involves risks including possible loss of principal. Any economic forecasts set forth may not develop as predicted and are subject to change. References to markets, asset classes, and sectors are generally regarding the corresponding market index. Indexes are unmanaged statistical composites and cannot be invested into directly. Index performance is not indicative of the performance of any investment and do not reflect fees, expenses, or sales charges. All performance referenced is historical and is no guarantee of future results. Any company names noted herein are for educational purposes only and not an indication of trading intent or a solicitation of their products or services. LPL Financial doesn’t provide research on individual equities. All information is believed to be from reliable sources; however, LPL Financial makes no representation as to its completeness or accuracy. U.S. Treasuries may be considered “safe haven” investments but do carry some degree of risk including interest rate, credit, and market risk. Bonds are subject to market and interest rate risk if sold prior to maturity. Bond values will decline as interest rates rise and bonds are subject to availability and change in price. The Standard & Poor’s 500 Index (S&P500) is a capitalization-weighted index of 500 stocks designed to measure performance of the broad domestic economy through changes in the aggregate market value of 500 stocks representing all major industries. The PE ratio (price-to-earnings ratio) is a measure of the price paid for a share relative to the annual net income or profit earned by the firm per share. It is a financial ratio used for valuation: a higher PE ratio means that investors are paying more for each unit of net income, so the stock is more expensive compared to one with lower PE ratio. Earnings per share (EPS) is the portion of a company’s profit allocated to each outstanding share of common stock. EPS serves as an indicator of a company’s profitability. Earnings per share is generally considered to be the single most important variable in determining a share’s price. It is also a major component used to calculate the price-to-earnings valuation ratio. All index data from FactSet. This research material has been prepared by LPL Financial LLC. Securities and advisory services offered through LPL Financial (LPL), a registered investment advisor and broker-dealer (member FINRA/SIPC). Insurance products are offered through LPL or its licensed affiliates. To the extent you are receiving investment advice from a separately registered independent investment advisor that is not an LPL affiliate, please note LPL makes no representation with respect to such entity. Not Insured by FDIC/NCUA or Any Other Government Agency | Not Bank/Credit Union Guaranteed | Not Bank/Credit Union Deposits or Obligations | May Lose Value
RES-934700-1021 | For Public Use | Tracking # 1-05204667 (Exp. 10/22)
Several policy-related risks loom in September and October that may lead to an increase in market volatility. The debt ceiling needs to be raised (likely by mid-October), the government needs to be funded to avoid a shutdown by the end of September, and the Democrats are trying to pass two major spending bills and will need to provide greater clarity on tax increases over the next several weeks. We believe the greatest risks come from the debt ceiling and taxes, but expect neither to have much near-term impact on the general trajectory of the bull market. There’s always something going on in Washington, but with summer behind us, policy debates are heating up with an unusual number of high-profile policy issues looming for Congress and President Joe Biden in September and October. Those include the debt ceiling; the fate of the bipartisan infrastructure bill; clarity and potential progress on the much larger American Families Plan (AFP) spending package emphasizing Democratic priorities (also known as the human infrastructure bill); and, not to be forgotten, simply funding the government. These very well could be the peak policy months of President Biden’s first term, akin to the months leading up to the passage of the Affordable Care Act under President Barack Obama and the Tax Cuts and Jobs Act under President Donald Trump. This week we break down what market participants should be watching, possible sources of risk, and our expectations.
Looming Deadlines Forcing the Action
September and October aren’t important policy months simply because there’s a lot going on—looming deadlines are forcing the action. Keep in mind that Congress is notorious for not acting until the last possible moment and even pushing back deadlines whenever it can, as different members of Congress try to squeeze one more concession out of negotiations. This will create a lot of noise and increased uncertainty, but is unfortunately the norm for how Congress operates. While every maneuver may be of genuine political interest, as an investor, it’s important not to get too caught up in Congressional drama. Here’s a quick overview of where we are right now and what may be coming next:
Bipartisan infrastructure bill – The bill, which includes about $550 billion in new spending over the next eight years and $1.2 trillion in total spending, was passed by the Senate on August 10. Since then, Democratic House leadership has been holding out on a vote, using the delay for political leverage to pull moderates on board for the larger spending package. On August 24, in exchange for voting in favor of the budget resolution needed for the AFP to progress, moderate Democrats were given a non-binding promise on infrastructure reaching the House floor for vote by September 27.
American Families Plan – The August 24 budget resolution was needed for Democrats to pass a large spending package under the reconciliation process, which requires only a simple majority to pass in the Senate. The budget resolution set a soft target of the bill moving out of committee by September 15. To date, Democrats have remained vague on how the bill will be paid for, but the House Ways and Means Committee will need to provide a concrete proposal by September 15, assuming the timeline holds up. In other words, by September 15 we’ll start getting clarity on who is getting taxed and how much. That’s when things start to get interesting.
Funding the government – A partial government shutdown takes place on October 1 unless a continuing resolution is passed to fund the government. That resolution would fund the government only for a limited specified time, at which point we do it all again. Often, the continuing resolution is made part of another bill that is hard to vote against, or it could get passed as part of the AFP using the reconciliation process
The debt ceiling – At some point, if Congress does not raise the debt ceiling the government would technically default on its current obligations. We don’t know exactly when that point will be, but it will likely come in mid-October. The government has been using extraordinary measures since early August to conserve cash so it can meet its obligations for as long as possible.
With deadlines forcing the action, what will market participants be watching? Primarily the debt ceiling and taxes. The two present contrasting risk profiles. Congress is extremely unlikely to let the U.S. default on its debt since it would likely have significant negative consequences for markets and the economy. On the other hand, Congress is very likely to raise taxes, driven by (slim) Democratic majorities in both chambers. But, based on history the immediate market impact is likely to be negligible, with the biggest risk around the hit to corporate earnings due to a higher corporate tax rate. On the other hand, taxes help contain deficits—it’s how you pay for what you spend, and for deficit hawks it’s preferable to borrowing. Best to spend wisely and tax lightly, but no president since 1960 has been able to achieve that except Bill Clinton. In the absence of that approach, paying for at last some of what you spend may be preferable to pushing the national debt even higher.
Debt Ceiling
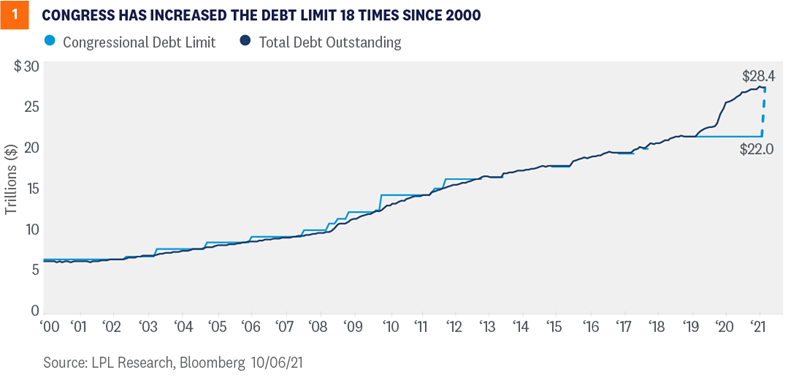
The debt ceiling is the maximum amount of debt that the Treasury Department can issue. The Treasury uses the money it borrows to pay its obligations. The amount is set through Congress and has been regularly increased as needed over the years. The consequences of not raising the debt ceiling are far from trivial. Not only would the U.S. government not be able to cover its expenses, it would also default on its debt—which could send shockwaves throughout the financial system. Through a bipartisan budget act in 2019, Congress suspended the debt ceiling through July 31, 2021, which allowed the government unfettered access to capital markets. As seen on the chart, when the suspension was enacted, total debt outstanding was $22 trillion—but current debt levels have risen to $28.4 trillion, which is the new debt ceiling level [Figure 1]. The debt ceiling will need to be raised soon or the U.S. Treasury will likely run out of its “extraordinary measures” to fund government activities. Treasury Secretary Janet Yellen recently said this would likely occur in October.
Congress can seemingly address the debt ceiling in one of two ways: increase the debt ceiling or suspend the debt ceiling again. Accordingly, Congress could insert a debt ceiling increase in the AFP bill, which would require only 50 votes, or suspend the debt ceiling for a certain period of time, similar to what happened in 2019, which would require 60 votes. Democrats could also attach a debt ceiling suspension to a stopgap government-funding bill, which may attract crossover support. But that route may be challenging. Forty-six of the 50 Republican senators have pledged that they will not vote for any increase in the debt ceiling. If the debt ceiling isn’t resolved, the U.S. government would technically default on its contractual obligations. Bond markets have been relatively sanguine about the prospects of a U.S. default, but we are starting to see yields move higher on Treasury bills maturing in late October and early November. Unless resolved, as we get into October, we could see short maturity Treasury yields move higher still as the prospects of non-repayment, however slight, get priced into the market. U.S. bond market investors have taken for granted the government’s ability and willingness to pay its debt. While its ability to repay its obligations is not in question, playing politics with the debt ceiling complicates the picture of the country’s willingness to pay its debts—which is part of why the credit rating on U.S. debt was lowered by Standard & Poor’s in 2011. While we think Congress is extremely likely to act in time and either raise or suspend the debt ceiling, these games of political chicken can introduce volatility to markets in the meantime.
Greater Clarity on Taxes is Coming
There are few near-term market risks from the planned spending in the AFP, although there may be longer-term risks due to rising debt and higher structural tax levels. But markets tend to like stimulus. There may be some market risks, however, around how the spending is paid for, which will be a combination of borrowing and taxes. Raising taxes has never been politically popular, and so far, Democrats have been somewhat vague about where the tax revenue would come from. But if Democrats are going to try to pass the infrastructure and AFP bills in September or October, they need to begin getting into specifics on taxes in the next week. President Biden has proposed increasing the corporate tax rate from 21% to 28%, though we see the rate ending up closer to 25%. At that rate, we estimate that S&P 500 earnings per share (EPS) would be reduced by about 5% in 2022. We believe there’s roughly 70% odds that these tax increases will go into effect starting January 1, 2022. As a result, our 2022 S&P 500 EPS forecast of $218 carries some downside risk. Individual taxes on upper-income individuals are also likely to go higher as the Democrats attempt to raise more than $1 trillion in tax revenue to fund a portion of their agenda. The Biden administration has proposed taking the top tax rate on ordinary income to 39.6% from 37%, and capital gains and taxes on those who earn more than $1 million to a maximum of 43.4% from the current 23.8%. While a capital gains tax increase on wealthy individuals is likely, we would expect an eventual compromise to land at a rate near 28%, which would put the total effective rate—including the 3.8% Affordable Care Act tax—at 31.8%. It’s logical to think impending tax increases could cause market volatility at some point as the path to those tax hikes becomes clearer. So far, stock prices have seemingly ignored this risk. We offer two primary reasons for that. First, these tax increases have been widely expected for quite some time. Remember, President Biden campaigned on them. And second, as we discussed in our Midyear Outlook 2021 publication, markets have generally held up well after past tax increases, including corporate and individual (though the sample size is small). Those who do not expect these tax hikes to be passed may also be providing some support for stocks. It won’t be easy to get moderate and progressive Democrats on the same page to pass such significant legislation with razor-thin majorities in the House and Senate.
Policy-Related Market Volatility Likely to be Short Lived
Whether the bi-partisan infrastructure bill and the AFP are passed as two bills or one (which is still a possibility), we think we are likely to see a total package of $2-2.5 trillion in new spending, funded by a combination of debt and $1-1.5 trillion in new taxes over approximately 10 years. We may see some pick-up in policy-related volatility as the legislative process moves forward around the two spending bills, funding the government, and the debt ceiling—but we believe most of the impact has been largely priced in. Depending on where corporate taxes end up, we could see some energy come out of the bull market, but it doesn’t lead to a substantive change in our outlook. For those who follow politics closely, the next several weeks will probably garner heavy interest. For market participants, though, we believe the priority will be to tune out the noise and not panic over deadline drama. The fundamental backdrop for the economy remains strong and corporate America continues to demonstrate extraordinary resiliency—and ultimately that’s what drives the stock market. Read previous editions of Weekly Market Commentary on lpl.com at News & Media. Barry Gilbert, PhD, CFA, Asset Allocation Strategist, LPL Financial
Lawrence Gillum, CFA, Fixed Income Strategist, LPL Financial
Jeff Buchbinder, CFA, Equity Strategist, LPL Financial ______________________________________________________________________________________________ IMPORTANT DISCLOSURES This material is for general information only and is not intended to provide specific advice or recommendations for any individual. There is no assurance that the views or strategies discussed are suitable for all investors or will yield positive outcomes. Investing involves risks including possible loss of principal. Any economic forecasts set forth may not develop as predicted and are subject to change. References to markets, asset classes, and sectors are generally regarding the corresponding market index. Indexes are unmanaged statistical composites and cannot be invested into directly. Index performance is not indicative of the performance of any investment and do not reflect fees, expenses, or sales charges. All performance referenced is historical and is no guarantee of future results. Any company names noted herein are for educational purposes only and not an indication of trading intent or a solicitation of their products or services. LPL Financial doesn’t provide research on individual equities. All information is believed to be from reliable sources; however, LPL Financial makes no representation as to its completeness or accuracy. US Treasuries may be considered “safe haven” investments but do carry some degree of risk including interest rate, credit, and market risk. Bonds are subject to market and interest rate risk if sold prior to maturity. Bond values will decline as interest rates rise and bonds are subject to availability and change in price. The Standard & Poor’s 500 Index (S&P500) is a capitalization-weighted index of 500 stocks designed to measure performance of the broad domestic economy through changes in the aggregate market value of 500 stocks representing all major industries. The PE ratio (price-to-earnings ratio) is a measure of the price paid for a share relative to the annual net income or profit earned by the firm per share. It is a financial ratio used for valuation: a higher PE ratio means that investors are paying more for each unit of net income, so the stock is more expensive compared to one with lower PE ratio. Earnings per share (EPS) is the portion of a company’s profit allocated to each outstanding share of common stock. EPS serves as an indicator of a company’s profitability. Earnings per share is generally considered to be the single most important variable in determining a share’s price. It is also a major component used to calculate the price-to-earnings valuation ratio. All index data from FactSet. Please read the full Midyear Outlook 2021: Picking Up Speed publication for additional description and disclosure. This research material has been prepared by LPL Financial LLC. Securities and advisory services offered through LPL Financial (LPL), a registered investment advisor and broker-dealer (member FINRA/SIPC). Insurance products are offered through LPL or its licensed affiliates. To the extent you are receiving investment advice from a separately registered independent investment advisor that is not an LPL affiliate, please note LPL makes no representation with respect to such entity. Not Insured by FDIC/NCUA or Any Other Government Agency | Not Bank/Credit Union Guaranteed | Not Bank/Credit Union Deposits or Obligations | May Lose Value
RES-868874-0821 | For Public Use | Tracking # 1-05189436 (Exp. 09/22)
Since we began our investing careers, we’ve had the concept of diversification drilled into our heads. Some refer to it as the only free lunch in investing. Well, when it comes to geography, that advice hasn’t been helpful for some time (you could say the same about value-style investing). Staying close to home and favoring the United States won’t always be the best move, but for now, we think it still is—as we discuss here.
Europe’s Economy Showing Solid Improvement
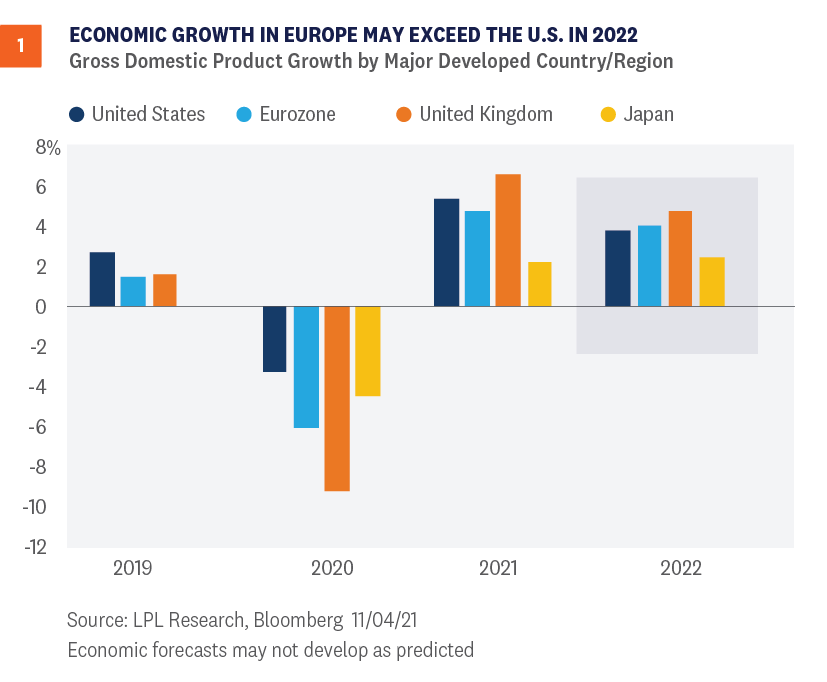
It’s been difficult to find a macroeconomic story that supports reducing exposure to U.S. equities in favor of their developed international counterparts. But frankly, if one is going to develop, it may need to happen soon. As COVID-19 cases have fallen globally in recent months, it sets up a potentially synchronized global expansion in 2022. If that global expansion is accompanied by a weaker U.S. dollar and value stocks can at least hold their own, then we think developed international equities could be in a fairly good position to potentially outperform U.S. equities. As shown in Figure 1, the consensus forecasts for gross domestic product (GDP) growth in 2022 are calling for the European economies (the Eurozone and the United Kingdom) to grow faster than the United States next year. Europe and Japan are both ahead of the United States right now in vaccinations administered as a percentage of their populations (source: Ourworldindata.org), after playing some catch-up, which positions those economies to take the next step forward in their recoveries. Europe and Japan are also earlier in their economic cycles, leaving more upside in terms of growth potential. Forecasts for economic growth in Europe do look a bit better on a relative basis next year, and economic growth expectations for the second half of 2021 have held up relatively well recently despite the COVID-19 Delta variant wave, based on Bloomberg’s consensus GDP forecasts. However, Europe’s economic momentum may be peaking based on purchasing managers’ index data. Moreover, the Citi Economic Surprise Index for Europe stands at -51.5, compared to the one-year average of +90. In other words, European economic data has been mostly falling short of expectations and even missing more frequently than the U.S., where the surprise index reading is -20.5. Japan’s surprise index is also weak at -79. With solid economic growth expected in Europe, perhaps even slightly better than in the U.S., a neutral view (or market weight) has solid support. But with momentum in Europe likely past its peak and growth in Japan lagging behind, the case for a more positive view of international equities is not particularly compelling.
International Earnings Look Good, But So Does The U.S.
Similar to the economic growth picture, earnings are recovering nicely in Europe and Japan, but they don’t stand out relative to the United States. As major global economies recover from the pandemic, MSCI EAFE Index earnings are poised to grow nearly 50% in 2021, though that is only a few percentage points better than the U.S., based on the latest consensus estimates from FactSet (and those are just estimates at this point). Estimate revisions have been more positive in the U.S. than internationally, indicative of better earnings momentum and offsetting the attraction of the extra bit of earnings growth potential. So, at this point we’ll call earnings a toss-up, though perhaps the U.S. has a slight edge given its track record of surpassing expectations and heavy exposure to technology, e-commerce, and digital media.
Waiting For Value Stocks To Have Their Day
Perhaps the biggest problem for international equities right now in their more than decade-long struggles to keep up with the United States is the leadership of growth-style equities. Over the last 10 years, the Russell 1000 Growth Index has outpaced its Value counterpart by about 6.5 percentage points per year, while the MSCI EAFE has lagged the S&P 500 Index by about 8 percentage points per year. The MSCI EAFE Index for non-US developed market equities has only a 10% weighting in the technology sector, compared with 28% in the S&P 500, making it very difficult for developed international equities to keep up with the U.S. in a growth-led market. Add in internet retail and digital media, and the gap between these two markets gets even bigger. We believe a pickup in economic growth globally over the next quarter or two will help value stocks at least match returns for the growth style, with cyclically oriented value stocks potentially doing even a little better—a key ingredient for developed international equities’ prospects. But as long as U.S. growth stocks are leading, developed international will have a very difficult time keeping up over any meaningful period.
Technical Trends Stay With The U.S.
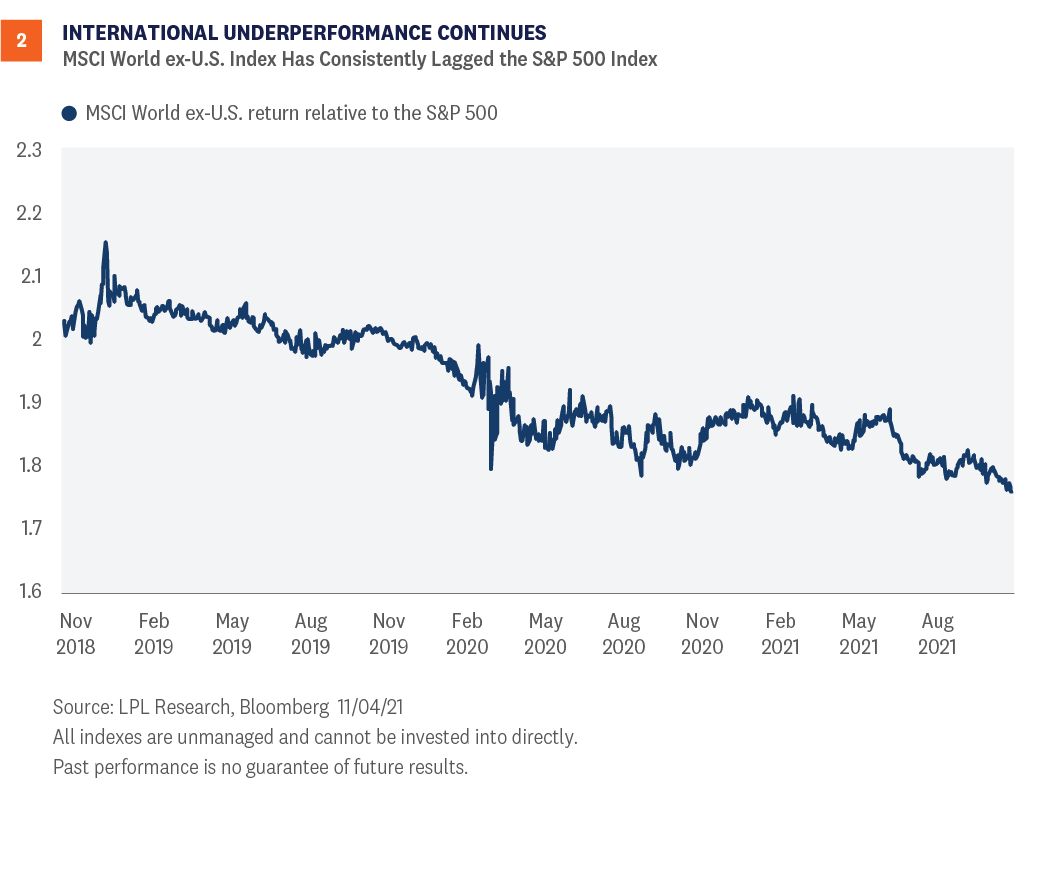
The technicals for international equities also support an overall cautious stance. As shown in Figure 2, the MSCI World Ex-U.S. Index, an index that incorporates both foreign developed and emerging markets, has continued to substantially lag the S&P 500, continuing the relative downtrend that had been in place prior to the pandemic. Dollar strength in 2021 is one reason for this, with the U.S. Dollar Index up more than 5% so far this year. Dollar strength hurts internationally diversified U.S. investors, as the currencies they are holding weaken relative to the dollar. However, even accounting for currency effects, international markets have steadily underperformed their U.S. counterparts, with China being one of the biggest culprits. China’s substantial weight in diversified emerging markets indexes is the primary reason the asset class has posted a slight loss so far this year. Looking forward, we see modest signs of technical improvement in China and international markets, but the accompanying chart shows the significant opportunity cost relative to the U.S., and would likely need to show some technical improvement, combined with an abatement of dollar strength, for us to consider a positive view of developed international (or overweight), or to reconsider our underweight recommendation for emerging markets.
Still Looks Like a Value trap
One of the most popular arguments in favor of investing in developed international equities has been valuations. Based on forward price-to-earnings ratios (PE), the MSCI EAFE Index is trading at a 27% discount to the S&P 500—the largest in the past 20 years and much larger than the average long-term discount of 9%. But stocks in Europe and Japan have been cheap for a long time, and it hasn’t helped relative performance. Valuations generally don’t tell us much about the next year or two, so we would need more reasons to re-allocate from U.S. equities to international than just low PE ratios. However, lower valuations have historically been well correlated with long-term returns, suggesting strategic investors who are in it for the long haul may benefit from international equity allocations.
Conclusion
If developed international market equities are going to outperform, we’re probably getting close to the point in time where we start to see it. Markets may be on the cusp of another rotation to value as global growth picks up, while economic growth in Europe, the majority of the MSCI EAFE Index, may exceed that of the U.S. next year. However, we still favor the U.S. over developed international markets as we enter 2022—primarily due to technical factors, including the weak momentum for the major stock indexes outside the U.S., the strong U.S. dollar, and continued strength in U.S. growth stocks, which makes it hard for the more value-oriented markets in Europe and Japan to keep up. For developed international markets, neither economic growth nor earnings stand out relative to the U.S., so sticking with what’s been working makes sense. Finally, our emerging markets equities recommendation remains negative due to ongoing regulatory risks in China, which could slow the growth of the Chinese economy and earnings, while also increasing uncertainty. Jeffrey Buchbinder, CFA, Equity Strategist, LPL Financial
Scott Brown, CMT, Senior Analyst, LPL Financial ______________________________________________________________________________________________ IMPORTANT DISCLOSURES This material is for general information only and is not intended to provide specific advice or recommendations for any individual. There is no assurance that the views or strategies discussed are suitable for all investors or will yield positive outcomes. Investing involves risks including possible loss of principal. Any economic forecasts set forth may not develop as predicted and are subject to change. References to markets, asset classes, and sectors are generally regarding the corresponding market index. Indexes are unmanaged statistical composites and cannot be invested into directly. Index performance is not indicative of the performance of any investment and does not reflect fees, expenses, or sales charges. All performance referenced is historical and is no guarantee of future results. Any company names noted herein are for educational purposes only and not an indication of trading intent or a solicitation of their products or services. LPL Financial doesn’t provide research on individual equities. All information is believed to be from reliable sources; however, LPL Financial makes no representation as to its completeness or accuracy. U.S. Treasuries may be considered “safe haven” investments but do carry some degree of risk including interest rate, credit, and market risk. Bonds are subject to market and interest rate risk if sold prior to maturity. Bond values will decline as interest rates rise and bonds are subject to availability and change in price. The Standard & Poor’s 500 Index (S&P500) is a capitalization-weighted index of 500 stocks designed to measure performance of the broad domestic economy through changes in the aggregate market value of 500 stocks representing all major industries. The PE ratio (price-to-earnings ratio) is a measure of the price paid for a share relative to the annual net income or profit earned by the firm per share. It is a financial ratio used for valuation: a higher PE ratio means that investors are paying more for each unit of net income, so the stock is more expensive compared to one with lower PE ratio. Earnings per share (EPS) is the portion of a company’s profit allocated to each outstanding share of common stock. EPS serves as an indicator of a company’s profitability. Earnings per share is generally considered to be the single most important variable in determining a share’s price. It is also a major component used to calculate the price-to-earnings valuation ratio. All index data from FactSet. This research material has been prepared by LPL Financial LLC. Securities and advisory services offered through LPL Financial (LPL), a registered investment advisor and broker-dealer (member FINRA/SIPC). Insurance products are offered through LPL or its licensed affiliates. To the extent you are receiving investment advice from a separately registered independent investment advisor that is not an LPL affiliate, please note LPL makes no representation with respect to such entity. Not Insured by FDIC/NCUA or Any Other Government Agency | Not Bank/Credit Union Guaranteed | Not Bank/Credit Union Deposits or Obligations | May Lose Value
RES-947201-1121| For Public Use | Tracking # 1-05209658 (Exp. 11/22)
We have used most of the superlatives we know to describe corporate America’s stunning performances over the past two earnings seasons. Despite lofty expections, results exceeded estimates by the biggest margins we’ve ever seen (and one of the authors of this report has been doing this for 23 years). We expect solid earnings gains during the upcoming third-quarter earnings season, but upside surprises will be smaller. Unfortunately, we won’t need as many superlatives.
Look for Many—But Smaller—Upside Surprises
Earnings growth in the first half of 2021 was amazingly strong, with S&P 500 Index earnings growing 52% and 90% year over year in the first and second quarters, shown in Figure 1. The growth was stellar, but the most impressive thing to us about these numbers was the more than 20 percentage point upside surprises for both quarters. Those surprises came after the bar had already been raised following strong earnings results during the second half of 2020. After being pleasantly surprised by corporate America for a year now, we won’t totally dismiss the possibility of big upside surprises again during the third-quarter earnings season. However, we would point to several reasons we think earnings growth overall will be much closer to the current third-quarter consensus estimate implying a 29% increase:
Slower economic growth from the Delta variant. According to the Federal Reserve Bank of Atlanta’s estimate, the growth rate of gross domestic product (GDP) for the third quarter is tracking to just 1.3%, down from 6% two months ago. Manufacturing demand remains robust based on new orders, but company surveys and anecdotes continue to point to difficulty filling those orders due to the supply chain disruptions.
Supply chain challenges have intensified. We have heard from a number of global companies in recent weeks that their profit margins are coming under more pressure from supply chain challenges. Nike cited shipping delays and factory shutdowns in Vietnam for lowering its guidance. FedEx lowered guidance amid rising labor costs, staffing shortages, and logistical challenges. Sherwin-Williams cut its outlook, citing materials shortages and higher-than-expected input cost inflation, exacerbated by Hurricane Ida. Margin pressures from shortages of labor and materials will be a common theme for the third quarter—and likely a quarter or two beyond.
Pre-announcement numbers are good, but not quite up to second quarter levels. The number of S&P 500 companies providing positive guidance for the third quarter has decreased by 11 compared to the second quarter, according to FactSet. Meanwhile, the number of companies providing negative guidance for the third quarter has increased by 10 compared with the second quarter. Still, more companies have provided positive guidance than negative guidance for five straight quarters for the first time in at least 15 years, which signals more than just a few percentage points of upside surprise to the S&P 500 earnings estimate.
Smaller increase in the consensus estimate. The estimate for third-quarter earnings rose during the quarter, but not as much as it did leading up to first- and second-quarter earnings seasons. The consensus third-quarter S&P 500 earnings estimate rose 2.9% over the three months ending September, down from increases of 7.2% for second-quarter earnings in the second quarter, and 6.5% for first-quarter earnings during the first quarter. Any increase is good, however, given the long-term average is a declineof 5%.
Bottom line—expect upside as earnings continue to benefit from the reopening and high profit margins. But don’t expect the massive upside surprises of recent quarters. A third-quarter earnings growth rate in the mid-to-high 30s would be excellent.
What We're Watching
Here are three things we will be watching as the numbers roll in and companies share thoughts about the future:
How long might supply chain issues last? It will be very interesting to hear how long companies expect supply chain bottlenecks and shortages of labor and materials to last. These pressures on companies’ costs may impair profit margins for the rest of 2021—and likely into 2022. Raising prices will help, but unfilled orders may cap revenue growth, making it difficult for companies to beat analysts’ earnings targets.
What is the outlook for wage increases? Wages are a big component of corporate America’s cost structure. We will be looking for confidence from companies that wage pressures will not get much stronger, though we anticipate higher wages will eat into profit margins in coming quarters. The question is how much. Productivity gains from technology investments (i.e., doing more with less) can only go so far in containing wage increases, which are already running above 4% annualized.
How will stocks react to smaller upside surprises? Investors and analysts may have gotten spoiled by massive upside surprises in recent quarters. We’re interested to see how the market will react to smaller beats and guidance that may not be enough to push analysts’ estimates materially higher. While most companies will clear the higher bar, few will soar well above it as so many did last quarter.
Conclusion
Earnings growth in the third quarter will likely be quite strong, possibly making a run at 40%. While that’s excellent growth, it’s a far cry from the 90% increase in S&P 500 earnings in the second quarter. It will be interesting to see how corporate America wades through supply chain issues. If those headwinds are continuing to intensify, then our $205 estimate for 2021 S&P 500 earnings will be tough to reach (FactSet’s consensus estimate is currently $201). Against this more challenging earnings backdrop, we maintain our positive stock market outlook. In the near term, we continue to look for dips to buy, given the prospects for a pickup in economic growth in the fourth quarter, still low interest rates, and historically strong fourth-quarter returns. Risks include another COVID-19 wave, stubbornly “sticky” inflation that could push interest rates sharply higher, potential tax increases in 2022, and, as always, geopolitics. Looking out to 2022, prospects for above-average economic growth and further earnings gains potentially point to another good year for stock investors, though probably not as good as 2021 has been. We expect interest rates to stay low enough to justify maintaining current valuations as earnings grow, which could set the stage for double-digit returns for the S&P 500 in 2022. More to come on our 2022 outlook in early December with the release of the yet-to-be-named Outlook 2022.
Jeff Buchbinder, CFA, Equity Strategist, LPL Financial
Ryan Detrick, CMT, Chief Market Strategist, LPL FinancialIMPORTANT DISCLOSURESThis material is for general information only and is not intended to provide specific advice or recommendations for any individual. There is no assurance that the views or strategies discussed are suitable for all investors or will yield positive outcomes. Investing involves risks including possible loss of principal. Any economic forecasts set forth may not develop as predicted and are subject to change.References to markets, asset classes, and sectors are generally regarding the corresponding market index. Indexes are unmanaged statistical composites and cannot be invested into directly. Index performance is not indicative of the performance of any investment and do not reflect fees, expenses, or sales charges. All performance referenced is historical and is no guarantee of future results.Any company names noted herein are for educational purposes only and not an indication of trading intent or a solicitation of their products or services. LPL Financial doesn’t provide research on individual equities. All information is believed to be from reliable sources; however, LPL Financial makes no representation as to its completeness or accuracy. US Treasuries may be considered “safe haven” investments but do carry some degree of risk including interest rate, credit, and market risk. Bonds are subject to market and interest rate risk if sold prior to maturity. Bond values will decline as interest rates rise and bonds are subject to availability and change in price. The Standard & Poor’s 500 Index (S&P500) is a capitalization-weighted index of 500 stocks designed to measure performance of the broad domestic economy through changes in the aggregate market value of 500 stocks representing all major industries. The PE ratio (price-to-earnings ratio) is a measure of the price paid for a share relative to the annual net income or profit earned by the firm per share. It is a financial ratio used for valuation: a higher PE ratio means that investors are paying more for each unit of net income, so the stock is more expensive compared to one with lower PE ratio. Earnings per share (EPS) is the portion of a company’s profit allocated to each outstanding share of common stock. EPS serves as an indicator of a company’s profitability. Earnings per share is generally considered to be the single most important variable in determining a share’s price. It is also a major component used to calculate the price-to-earnings valuation ratio. All index data from FactSet. Please read the full Midyear Outlook 2021: Picking Up Speed publication for additional description and disclosure. This research material has been prepared by LPL Financial LLC. Securities and advisory services offered through LPL Financial (LPL), a registered investment advisor and broker-dealer (member FINRA/SIPC). Insurance products are offered through LPL or its licensed affiliates. To the extent you are receiving investment advice from a separately registered independent investment advisor that is not an LPL affiliate, please note LPL makes no representation with respect to such entity. Not Insured by FDIC/NCUA or Any Other Government Agency | Not Bank/Credit Union Guaranteed | Not Bank/Credit Union Deposits or Obligations | May Lose Value RES-928450-1021 | For Public Use | Tracking # 1-05201962 (Exp. 10/22)
With the fourth quarter underway—historically the best quarter for stocks, by the way—2022 is fast approaching. While a lot can still happen between now and the end of 2021, we don’t think it’s too early to start thinking about what stocks might do next year. We see a favorable economic environment for stocks in 2022, consistent with prior mid-cycle expansion years and bolstered by continued earnings growth. The gains may not come easy, however, with a number of risks such as COVID-19-related supply chain disruptions, inflation, and higher interest rates.
WE START TOP DOWN
As 2021 winds down, we are starting to look ahead to 2022. As a starting point to begin forecasting stock market performance next year, we want to first assess the economic growth outlook and where we are in the economic cycle. If we are approaching the middle of an economic cycle that has at least a few more years to go (our view), then we believe the chances of another good year for stocks in 2022 are fairly high. Mid-cycle simply means we do not believe a recession is likely anytime soon—nor do we expect the big equity gains typically seen when the economy emerges from recession (those came last year). Looking back at the past 50 years, the S&P 500 Index was up an average of 12% during the 27 mid-cycle years we identified, with gains in 81% of those years. We also acknowledge that stocks are up a lot and valuations are elevated (more on that below). The S&P 500 is up 16% year-to-date and 95% since the March 2020 low, which to us means the probability of another big up year in 2022 is relatively low. However, with the economy poised to grow (we expect above-average gross domestic product growth in 2022) the chances of solid gains remain high.
EARNINGS ARE A KEY PIECE OF THE PUZZLE
A growing economy is a great start, but stocks fundamentally derive their value from their earnings stream and earnings start with revenue. The environment for companies to grow revenue next year should be excellent with above-average potential economic growth and some pricing power from elevated inflation. Historically, S&P 500 revenue growth is well correlated to nominal gross domestic product (GDP) growth. Nominal GDP growth is real GDP growth (inflation adjusted) plus inflation. Hypothetically, 4% GDP growth next year (consensus forecast of Bloomberg-surveyed economists) plus perhaps 3% inflation (consensus forecast for the increase in the Consumer Price Index) puts a 7% revenue increase in play. Without any change in profit margins (probably too rosy but let’s keep it simple) and some share repurchases to lower the share counts—a near 10% increase in earnings in 2022 looks to be within the realm of possibility, which is reflected in current consensus estimates shown in Figure 1. Significant earnings momentum is also bullish, with estimates having been raised significantly by analysts over the past six months, also shown in Figure 1. But COVID-19-related supply chain issues and materials and labor shortages may push costs up and pressure corporate profit margins in 2022. Several companies have already warned of such pressures ahead of thirdquarter earnings season (more on that in an upcoming commentary). As a result, we are forecasting S&P 500 earnings growth of 6% in 2022—$218 per share after $205 per share in 2021, shown in Figure 2. However, higher corporate taxes, which we see as likely, may eat into much of those earnings gains in 2022. So, while we anticipate stocks will get some help from earnings in 2022 and expectations for more earnings growth in 2023, uncertainty is clearly high.
EARLY THOUGHTS ON 2022 STOCK MARKET FORECAST
As we think about where stocks might go in 2022, we want to assess where valuations might be in a year and what type of earnings growth markets may be pricing in for 2023 at that time. Looking at valuations first, they are elevated—but strong earnings gains during the ongoing economic recovery and the recent stock market pullback have lowered the price-to-earnings ratio (P/E) for the S&P 500 to about 20.5. Interestingly, the S&P 500 is up 16% year-to-date while the consensus estimate for the index’s EPS in 2021 has risen 20% since January 1, showing that stocks are actually cheaper now than they were at the start of this year. We believe still low interest rates justify current valuation levels, but if rates rise next year as we expect, P/E
multiples are unlikely to rise and may edge lower. That means earnings growth will likely be the primary driver of stock market gains in 2022. Turning to earnings and looking beyond next year, if we assume S&P 500 EPS growth returns to its long-term average in 2023 of about 9% ($218 to roughly $237), while the P/E stays at 20.5, the S&P 500 could be fairly valued at 4,870 at the end of 2022, or 12% above the September 30 close. That seems like a reasonable place to start—though that is not our official forecast—with several percentage points of gains potentially coming in the fourth quarter. The upside to that could come from valuations if interest rates stay lower for longer. The downside
could come from margin pressures, particularly wages, which could chop a few more points off of earnings growth over the next year or two.
CONCLUSION
It’s not too early to start thinking about 2022 as the fourth quarter gets underway. Prospects for above-average economic growth and further earnings gains next year point to another good year for stock investors. We expect interest rates to stay low enough to justify maintaining current valuations, which could set the stage for double digit returns for the S&P 500 next year. Look for more on the earnings outlook in an upcoming commentary previewing third-quarter earnings. And once earnings season gets rolling, we’ll get rolling on writing Outlook 2022. Finally, for those more concerned about finishing up 2021 than what 2022 may have in store, we would not be surprised to see a bit more volatility around China, Covid-19, the Federal Reserve taper, high inflation, supply chain disruptions, and Washington, D.C., headlines. We would look to be buyers on dips given the mostly favorable macroeconomic backdrop, low interest rates, and historically strong fourth-quarter returns. IMPORTANT DISCLOSURES
This material is for general information only and is not intended to provide specific advice or recommendations for any individual. There is no assurance that the views or strategies discussed are suitable for all investors or will yield positive outcomes. Investing involves risks including possible loss of principal. Any economic forecasts set forth may not develop as predicted and are subject to change. References to markets, asset classes, and sectors are generally regarding the corresponding market index. Indexes are unmanaged statistical composites and cannot be invested into directly. Index performance is not indicative of the performance of any investment and do not reflect fees, expenses, or sales charges. All performance referenced is historical and is no guarantee of future results. Any company names noted herein are for educational purposes only and not an indication of trading intent or a solicitation of their products or services. LPL Financial doesn’t provide research on individual equities. All information is believed to be from reliable sources; however, LPL Financial makes no representation as to its completeness or accuracy. U.S. Treasuries may be considered “safe haven” investments but do carry some degree of risk including interest rate, credit, and market risk. Bonds are subject to market and interest rate risk if sold prior to maturity. Bond values will decline as interest rates rise and bonds are subject to availability and change in price. The Standard & Poor’s 500 Index (S&P500) is a capitalization-weighted index of 500 stocks designed to measure performance of the broad domestic economy through changes in the aggregate market value of 500 stocks representing all major industries. The PE ratio (price-to-earnings ratio) is a measure of the price paid for a share relative to the annual net income or profit earned by the firm per share. It is a financial ratio used for valuation: a higher PE ratio means that investors are paying more for each unit of net income, so the stock is more expensive compared to one with lower PE ratio. Earnings per share (EPS) is the portion of a company’s profit allocated to each outstanding share of common stock. EPS serves as an indicator of a company’s profitability. Earnings per share is generally considered to be the single most important variable in determining a share’s price. It is also a major component used to calculate the price-to-earnings valuation ratio. All index data from FactSet. This research material has been prepared by LPL Financial LLC. Securities and advisory services offered through LPL Financial (LPL), a registered investment advisor and broker-dealer (member FINRA/SIPC). Insurance products are offered through LPL or its licensed affiliates. To the extent you are receiving investment advice from a separately registered independent investment advisor that is not an LPL affiliate, please note LPL makes no representation with respect to such entity. Not Insured by FDIC/NCUA or Any Other Government Agency | Not Bank/Credit Union Guaranteed | Not Bank/Credit Union Deposits or Obligations | May Lose Value RES-894867-0921 | For Public Use | Tracking #1-05196942 (Exp. 10/22)
With Halloween over the weekend, what better to write about this week than what scares us? If our positive near-term market outlook proves to be overly optimistic, we believe one—or perhaps more than one—of these five things will likely be the culprit: inflation, an aggressive Federal Reserve, profit margin pressures, pulling forward of seasonal gains, and potentially overly bullish sentiment.
Inflation
Central bankers are slowly acknowledging that inflation may be stickier than expected and that risks continue to tilt to the upside. At the same time, the baseline view remains that inflation will settle back toward historical norms over time. How long will that take? While inflation has come down some recently, we believe there may be another leg higher in the fourth quarter or early next year as the post-surge reopening pushes prices higher in areas where it had paused or declined as economic activity slowed, such as air fares, lodging, and used cars. The consensus expectation of Bloomberg-surveyed economists is that Consumer Price Index (CPI) year-trailing inflation will fall to 3.3% by the end of 2022 and 2.3% at the end of 2023. Many consumers, though, are finding inflation risks scarier, both due to sensitivity to prices in grocery stores and at the pump—and heavy news coverage. The wild card remains how long it will take supply chain disruptions to sort themselves out—they’ve been a key source of imbalances between supply and demand that have pushed prices higher. Also consider that the secular forces that put downward pressure on inflation for the past several decades (technology, “Amazon effect,” demographics, etc.) remain in place.
Aggressive Federal Reserve
Since March 2020, the Federal Reserve (Fed) has supported the economy and financial markets by purchasing $120 billion in U.S. Treasury and mortgage securities each month and keeping short-term interest rates near zero. As the economy continues to recover, however, the need for continued monetary support wanes. As such, the Fed is expected to fully end its bond buying programs by mid-2022 with interest rate hikes. In our view, this is likely coming in early 2023. The big wildcard remains how “sticky” inflation will be throughout 2022. As noted above, we think current inflationary pressures will abate over the next six to 12 months. However, if inflation is stickier than we are anticipating and the Fed is forced to aggressively respond early next year—first by potentially speeding up its tapering plans, and then by increasing short-term interest rates—economic growth will likely be negatively impacted. While we expect an orderly withdrawal of monetary support, an aggressive Fed reaction function to sustained inflationary pressures would likely spook financial markets.
Profit Margin Pressure
Third-quarter earnings results have been good overall. Companies have generally done an excellent job managing through supply chain disruptions, labor and materials shortages, and related cost pressures. Despite a high bar, a solid 82% of the roughly 280 S&P 500 companies that have reported have exceeded earnings targets. But there are reasons for concern. Profit margins are well above their pre-pandemic highs and carry downside risk. With labor in short supply (10.4 million job openings according to the Bureau of Labor Statistics, about 3 million above pre-pandemic levels), employers are having to pay up for talent. Wage growth accelerated to 4.6% year over year in September and will likely rise further—on top of the shortages of materials that push the prices up for manufacturers. These pressures on companies’ costs could impair profit margins if they continue to build. Consumers and businesses can afford to pay higher prices now but may balk at some point. For now, strong revenue growth is overshadowing these margin pressures but with stock valuations elevated, it’s important that earnings come through or markets may get spooked.
Seasonal Gains May Have Come Early
Stocks had one of their best Octobers ever, with the S&P 500 Index up more than 6% in the first month of the historically strong fourth quarter. But that’s the problem: October very well could have stolen some of the gains we usually see later in the year. The S&P 500 has historically gained 3.3%, on average, the final two months of the year. But, when the S&P 500 is up more than 5% in October, that average gain drops to 2.1% with a median of only 1.1%. After the year we’ve had, we don’t think anyone would have any issue with only modest additional upside through year-end, but we’d temper expectations on just how much green we could have the final two months. Some of the risks on this list could easily lead to another pullback like the one stocks experienced in September despite the generally positive economic and earnings backdrop.
Bullish Sentiment
We wrote last week about the bullish technical setup we see for equities in the final months of the year, and we believe the weight of the evidence supports that thesis. However, if there is a technical risk to watch, it is likely sentiment. The S&P 500 gained more than 6% in October following its first 5% pullback of the year, and as the saying goes, “nothing changes sentiment like price.” The percent of bulls in the American Association of Individual Investors (AAII) Investor Sentiment Survey more than doubled from its mid-September lows, while the VIX Index, a measure of implied volatility in the S&P 500 Index, is near its lowest level since before the pandemic began. Overall, we do not see evidence that sentiment is near extreme levels yet, or that the technical trends do not support a bullish view. But if the next few months do bring equity gains, sentiment may become a bigger risk. Conclusion
There you have it. Five things that scare us. That doesn’t mean there aren’t others (China anyone?). But if stocks suffer any meaningful volatility in the next couple of months, we think the culprit will likely be on this list. These potential scares do not, however, sway us from our positive near-term market outlook given prospects for a pickup in economic growth in the near term as COVID-19 cases decline. Stocks remain in a favorable seasonal period and low interest rates remain supportive. Stocks may also garner support from a potentially smaller-than-expected tax increase out of Washington, D.C. Ryan Detrick, CMT, Chief Market Strategist, LPL Financial
Jeffrey Buchbinder, CFA, Equity Strategist, LPL Financial
Barry Gilbert, PhD, CFA, Asset Allocation Strategist, LPL Financial
Lawrence Gillum, CFA, Fixed Income Strategist, LPL Financial ______________________________________________________________________________________________ IMPORTANT DISCLOSURES This material is for general information only and is not intended to provide specific advice or recommendations for any individual. There is no assurance that the views or strategies discussed are suitable for all investors or will yield positive outcomes. Investing involves risks including possible loss of principal. Any economic forecasts set forth may not develop as predicted and are subject to change. References to markets, asset classes, and sectors are generally regarding the corresponding market index. Indexes are unmanaged statistical composites and cannot be invested into directly. Index performance is not indicative of the performance of any investment and does not reflect fees, expenses, or sales charges. All performance referenced is historical and is no guarantee of future results. Any company names noted herein are for educational purposes only and not an indication of trading intent or a solicitation of their products or services. LPL Financial doesn’t provide research on individual equities. All information is believed to be from reliable sources; however, LPL Financial makes no representation as to its completeness or accuracy. U.S. Treasuries may be considered “safe haven” investments but do carry some degree of risk including interest rate, credit, and market risk. Bonds are subject to market and interest rate risk if sold prior to maturity. Bond values will decline as interest rates rise and bonds are subject to availability and change in price. The Standard & Poor’s 500 Index (S&P500) is a capitalization-weighted index of 500 stocks designed to measure performance of the broad domestic economy through changes in the aggregate market value of 500 stocks representing all major industries. The PE ratio (price-to-earnings ratio) is a measure of the price paid for a share relative to the annual net income or profit earned by the firm per share. It is a financial ratio used for valuation: a higher PE ratio means that investors are paying more for each unit of net income, so the stock is more expensive compared to one with lower PE ratio. Earnings per share (EPS) is the portion of a company’s profit allocated to each outstanding share of common stock. EPS serves as an indicator of a company’s profitability. Earnings per share is generally considered to be the single most important variable in determining a share’s price. It is also a major component used to calculate the price-to-earnings valuation ratio. All index data from FactSet. This research material has been prepared by LPL Financial LLC. Securities and advisory services offered through LPL Financial (LPL), a registered investment advisor and broker-dealer (member FINRA/SIPC). Insurance products are offered through LPL or its licensed affiliates. To the extent you are receiving investment advice from a separately registered independent investment advisor that is not an LPL affiliate, please note LPL makes no representation with respect to such entity. Not Insured by FDIC/NCUA or Any Other Government Agency | Not Bank/Credit Union Guaranteed | Not Bank/Credit Union Deposits or Obligations | May Lose Value
RES-942600-1021| For Public Use | Tracking # 1-05207404 (Exp. 11/22)
Last week, Congress was able to push back a fast-approaching deadline for raising the debt ceiling to December. Markets applauded the move with a relief rally. Despite decreased uncertainty in the near term, we may be confronted with the same problem again in a couple of months. This week we look more closely at the role the debt ceiling plays in government financing, what could happen if the debt ceiling is not raised in a timely way, and why market participants were skittish about the approaching deadline as we look ahead to December. Democrats and Republicans struck a deal last week to raise the debt ceiling, prompting a relief rally in equity markets. While failing to raise the debt ceiling was extremely unlikely, if it had happened it could have potentially done considerable damage to markets and the economy. But even approaching the deadline when the government would no longer be able to meet its obligations was having an impact. The mere appearance of Democrats and Republicans playing politics with the deadline was weighing on markets and forcing businesses to prepare for the very unlikely, but still possible, outcome of a government default. Unfortunately, we may have to do this all over again in December, and Congress does not yet seem to have fully learned from the 2011 debt-ceiling debacle that this issue is not to be taken lightly. Even if the current solution is just kicking the can for a couple of months, it does remove the immediate danger and opens up additional paths to address the problem well before the next deadline. The important debt-ceiling debate will continue, although with a reduced sense of urgency in the near term. In this Weekly Market Commentary, we take a closer look at the debt ceiling and the potential consequences of failing to raise it. 13 Questions Answered About the U.S. Debt Ceiling
1. What is the debt ceiling?
The debt ceiling is the limit on how much the federal government can borrow. Unlike every other democratic country (except Denmark), a limit on borrowing is set by statute in the U.S., which means Congress must raise the debt ceiling for additional borrowing to take place.
2. Why does the U.S. do it differently?
The debt ceiling was originally created to make borrowing easier by unifying a sprawling process for issuing debt to help fund U.S. participation in World War I. The process was further streamlined to help fund participation in World War II, creating the debt-ceiling process in use today. According to the Constitution, Congress is responsible for authorizing debt issuance, but there are many potential mechanisms that could make the process smoother.
3. Why is it important to raise the debt ceiling?
The government uses a combination of revenue, mostly through taxes, and additional borrowing to pay its current bills—including Social Security, Medicare, and military salaries—as well as the interest and principal on outstanding debt. If the debt ceiling isn’t raised, the government will not be able to meet all its current obligations and could default.
4. Has Congress always raised the debt ceiling?
Yes, whenever needed. According to the Department of the Treasury (“Treasury”), since 1960 Congress has raised the debt ceiling in some form 79 times, 49 times under Republican presidents and 30 times under Democratic presidents. As shown in Figure 1, Congress has regularly raised the debt ceiling as needed. In fact, every president since Herbert Hoover has seen the debt ceiling raised during their administration.
5. Is the debt ceiling being raised to cover potential new spending programs?
No. Lifting the debt ceiling does not authorize any new spending. The debt ceiling needs to be raised to meet current obligations already authorized by Congress. Theoretically, not raising the debt ceiling would limit spending in the future, but only by deeply undermining the basic ability of the government to function, including funding the military, mailing out Social Security payments, and making interest and principal payments on its current debt. While perhaps symbolic of excessive spending, the debt ceiling is not the appropriate instrument to limit spending. Spending responsibility sits with Congress and the president, but Democrats and Republicans have both favored deficit-financed spending once in power. Bill Clinton’s presidency, much of it with a Republican Congress, was the only one that saw the publicly held national debt decline since Calvin Coolidge in the 1920s.
6. When was the debt ceiling last raised?
In August 2019 the debt ceiling was suspended for two years in a bipartisan budget deal and reinstated on August 1, 2021 at a level covering all borrowing to that date, the dashed line in Figure 1 representing the debt increase over that two-year period. Additional borrowing above the level that went into effect on August 1 has not been authorized.
7. If we were at the debt ceiling on August 1 and nothing happened, why is there a problem?
When we hit the debt ceiling, the Treasury is authorized to use “extraordinary measures” that allow the government to continue to temporarily meet its obligations, including suspending Treasury reinvestment in some retirement-related funds for government employees. The additional funding available through these measures is limited. Treasury Secretary Janet Yellen had said extraordinary measures would no longer be able to cover all government obligations as of October 18.
8. What’s the new deadline?
The recent increase in the debt ceiling will enable the government to meet its obligations through December 3, with maybe an additional few weeks from extraordinary measures, which have already been depleted.
9. Who won the debt ceiling battle?
Markets, the economy, and U.S. households and businesses. As for who won the battle politically—we leave to the politicians and voters.
10. What would the Treasury have to do if Congress failed to act in time?
Without the ability to issue new debt to pay existing claims, the Treasury would have to rely on current cash on hand and incoming cash, largely from taxes, to make its payments. So, the Treasury would be able to make some payments—just not all of them. As such, the Treasury department would likely have to prioritize its payments, although that could bring legal challenges. Moreover, the longer the delay in raising/suspending the debt ceiling, the harder it would be for the Treasury to make its payments. For a delay of a month for example, it is estimated that the Treasury department could only cover approximately 60% of its obligations. In that instance, severe spending cuts would likely be necessary. In 2011 and again in 2013, Federal Reserve and Treasury officials developed a plan in case the debt ceiling wasn’t addressed in time. At that time, they determined the “best” course of action would be to prioritize debt payments over payments to households, businesses, and state governments. By prioritizing Treasury debt obligations, it was assumed that the financial repercussions would be minimized. However, given recent comments by rating agencies (more on this below), there’s no guarantee that prioritizing debt payments would stave off severe, longer-term consequences like a debt downgrade or higher borrowing costs. Nonetheless, in order to adhere to the full faith and credit clause within the Constitution, debt-servicing costs would likely be prioritized.
11. U.S. Treasury debt was downgraded in August 2011 because Congress waited until the last minute to raise the debt ceiling. Could we see additional rating changes this time?
In August 2011, even though Congress acted before the U.S. was no longer able to meet all its obligations, one of the three main rating agencies, Standard & Poor’s (S&P), downgraded U.S. Treasury debt one notch from AAA to AA+. While the other two rating agencies retained the U.S. AAA rating, they both downgraded the outlook to negative. S&P has maintained that AA+ rating since 2011. Today, another of the three main rating agencies, Fitch, has threatened to downgrade U.S. debt if the debt ceiling isn’t raised or suspended in time. Further, Fitch has stated that prioritization of debt payments would lead to non-payment or delayed payment of other obligations “which would likely undermine the U.S.’s ‘AAA’ status.” So even if the Treasury made debt payments on time, the other obligations would be missed and likely result in a rating downgrade. Other rating agencies probably would follow suit as well. Another downgrade by a major rating agency may call into question use of Treasury securities as risk-free assets, which would have major financial implications globally. Of course, don’t forget that after the downgrade in August 2011, investors flocked to long-term U.S. Treasuries.
12. Could failure to address the debt ceiling push the economy into a recession?
It would depend on how long the Treasury would have to prioritize payments. If the delay is only a day or two, then it is unlikely the economy would slow enough to actually enter into a recession. Payments that were deferred would be repaid in arrears, so the economic impact would likely be minimal. However, if payment prioritization is necessary over a prolonged period of time—say a month or longer—this could indeed cause economic activity to contract. Since the government is running a fiscal deficit of around 7% of gross domestic product, and the Treasury could not issue debt to cover that deficit, spending cuts would need to take place. In that scenario, according to analysis by Oxford Economics, $1.5 trillion of spending would need to be cut. The spending cuts, if prolonged, would likely push the U.S. economy into recession. Moreover, the unknown knock-on effects, such as the impact on business confidence, would also likely slow economic growth.
13. How would a technical default impact the financial markets?
In 2011, which is probably the closest comparison to this year, the S&P 500 Index fell by over 16% in the span of 21 days due to the debt-ceiling debate and subsequent rating downgrade. The equity market ended the year roughly flat, so investors who were able to invest after that large drawdown were rewarded. However, that large drawdown was due solely to the policy mistake of not raising the debt ceiling in a timely manner. It’s likely that if Congress were to wait until the last minute again before raising or suspending the debt ceiling, equity markets would react similarly. Despite the downgrade, demand for intermediate and longer-term Treasuries actually picked up during the market volatility, pushing yields lower, as Treasuries are generally considered a “safe haven” asset. While that may have been the market reaction in 2011, there is no guarantee that, in the event of a technical default and further rating downgrades, Treasury securities would have a positive return this time around—particularly if Treasury securities lose their reputation as bonds that have no default risk.
Conclusion
Given the experience from 2011, we think it was prudent for Congress to raise the debt ceiling reasonably in advance of the October 18 deadline when the government would likely no longer be able to meet all its obligations. Political brinksmanship with the debt ceiling is a dangerous game, with likely relatively little to gain and much to lose. Despite the extension, the legislative agenda for the fourth quarter remains packed, we may run into the same problem again in December, and both parties are similarly motivated. But the extra time does mean there is an easier path to addressing the debt ceiling through the budget reconciliation process if Democrats choose to use it. For now, the relief from even the unlikely possibility of a debt-ceiling crisis is welcome and markets are justifiably reassured. Barry Gilbert, PhD, CFA, Asset Allocation Strategist, LPL Financial
Lawrence Gillum, CFA, Fixed Income Strategist, LPL Financial ______________________________________________________________________________________________ IMPORTANT DISCLOSURES This material is for general information only and is not intended to provide specific advice or recommendations for any individual. There is no assurance that the views or strategies discussed are suitable for all investors or will yield positive outcomes. Investing involves risks including possible loss of principal. Any economic forecasts set forth may not develop as predicted and are subject to change. References to markets, asset classes, and sectors are generally regarding the corresponding market index. Indexes are unmanaged statistical composites and cannot be invested into directly. Index performance is not indicative of the performance of any investment and do not reflect fees, expenses, or sales charges. All performance referenced is historical and is no guarantee of future results. Any company names noted herein are for educational purposes only and not an indication of trading intent or a solicitation of their products or services. LPL Financial doesn’t provide research on individual equities. All information is believed to be from reliable sources; however, LPL Financial makes no representation as to its completeness or accuracy. U.S. Treasuries may be considered “safe haven” investments but do carry some degree of risk including interest rate, credit, and market risk. Bonds are subject to market and interest rate risk if sold prior to maturity. Bond values will decline as interest rates rise and bonds are subject to availability and change in price. The Standard & Poor’s 500 Index (S&P500) is a capitalization-weighted index of 500 stocks designed to measure performance of the broad domestic economy through changes in the aggregate market value of 500 stocks representing all major industries. The PE ratio (price-to-earnings ratio) is a measure of the price paid for a share relative to the annual net income or profit earned by the firm per share. It is a financial ratio used for valuation: a higher PE ratio means that investors are paying more for each unit of net income, so the stock is more expensive compared to one with lower PE ratio. Earnings per share (EPS) is the portion of a company’s profit allocated to each outstanding share of common stock. EPS serves as an indicator of a company’s profitability. Earnings per share is generally considered to be the single most important variable in determining a share’s price. It is also a major component used to calculate the price-to-earnings valuation ratio. All index data from FactSet. Please read the full Midyear Outlook 2021: Picking Up Speed publication for additional description and disclosure. This research material has been prepared by LPL Financial LLC. Securities and advisory services offered through LPL Financial (LPL), a registered investment advisor and broker-dealer (member FINRA/SIPC). Insurance products are offered through LPL or its licensed affiliates. To the extent you are receiving investment advice from a separately registered independent investment advisor that is not an LPL affiliate, please note LPL makes no representation with respect to such entity. Not Insured by FDIC/NCUA or Any Other Government Agency | Not Bank/Credit Union Guaranteed | Not Bank/Credit Union Deposits or Obligations | May Lose Value
RES-921852-1021 | For Public Use | Tracking # 1-05199549 (Exp. 10/22)
Until recently, we expected the 10-year Treasury yield to end the year between 1.75% and 2.0%. Now, however, there are two key elements suggesting we are unlikely to see significantly higher interest rates by year end: The Delta variant’s impact on economic growth expectations, and the continued demand for U.S. Treasuries by foreign investors. As such, our new year-end target for the 10-year Treasury yield is between 1.50% and 1.75%. Coming into the year, and into our 2021 mid-year outlook, we expected Treasury yields would move higher than current levels. Higher inflation expectations, less involvement in the bond market by the Federal Reserve (Fed), and a record amount of Treasury issuance this year were all reasons we thought interest rates could end the year between 1.75% and 2.0%. Now, however, there are two key elements suggesting we’re unlikely to see significantly higher interest rates by year-end. The Delta variant’s impact on economic growth expectations and the continued demand for U.S. Treasuries by foreign investors are likely to limit the upside in long-term Treasury yields. As such, we are slightly lowering our year-end forecast for the 10-year Treasury yield. We now believe the 10-year Treasury yield will end the year between 1.50% and 1.75%.
Delta Variant Delying Full Economic Growth Potential
A key variable in determining the direction and level of interest rates is the expected growth rate of the economy. With everything else being equal, if the gross domestic product (GDP) growth rate is expected to increase, long-term Treasury yields tend to increase as well. The reverse is also generally true. Going into the COVID-19 lockdowns, we saw both growth expectations and 10-year Treasury yields fall significantly. However, as seen in Figure 1, after the successful development of the COVID-19 vaccines in early January, GDP growth expectations were generally revised higher (JPMorgan’s Economic Revision Index rises as economists’ expectations for economic growth improve). As such, long-term interest rates generally moved higher as well. However, due to the persistence of the Delta variant, we are starting to see GDP growth forecasts revised lower. That has kept interest rates relatively anchored at current levels. We think any potential slowdown in growth will be temporary, with future growth expectations eventually rising as the impact of the Delta variant wanes and the economy bounces back again, which we think will likely take place over the next six to 12 months. Until then though, long-term interest rates may have difficulty moving significantly higher from current levels.
Foreign Investors Still Incentivized to Invest in U.S. Treasuries
Another key reason we believe interest rates have not moved much higher this year is foreign investors’ interest in the U.S. Treasury markets. Global interest rates remain low by historical standards and compared to U.S. Treasury yields. In fact, a number of countries have 10-year Treasury yields close to 0.0% or even negative in certain countries. Aging demographics and strong social support programs have made many Japanese and European investors look outside of their home countries to help fund underfunded pension schemes. Currently, there remains nearly $15 trillion in negative-yielding debt globally, which makes the 1.33% 10-year Treasury yield (as of September 16) look extremely attractive. Moreover, when investing in U.S. markets, foreign investors have to be mindful of the currency risk associated with U.S. investments. Because foreign investors’ liabilities are denominated in their home currency, most foreign investors hedge out the dollar risk embedded within U.S. investments. There is a cost to hedging out that risk though, which limits the attractiveness of those cross-border investments. But as shown in Figure 2, even after considering those costs the yield pickup relative to Japanese government bonds (JGB) and/or German bunds can be substantial. Japanese and German/European investors in particular can earn an additional 1% per year by investing in U.S. Treasuries. While that may not sound like much, the alternative for many German/European investors is to pay the government 0.30% per year for 10 years for the right to own that debt. In this low-rate environment, any incremental yield pickup is welcome. As the Fed starts to raise short-term interest rates—likely in 2023—the costs to hedge the currency risk increases. But until then, the incentive for cross-border investment remains, which will likely constrain the amount of upside we will see in long-term U.S. yields through the end of 2021.
All Eyes on the Federal Reserve
The Fed is meeting this week to discuss its ongoing commitment to its asset purchase program. Since March 2020, the Fed has supported the economy and financial markets by purchasing $120 billion in Treasury and mortgage securities, and by keeping short-term interest rates near zero. As the economy continues to recover, however, the need for continued monetary support wanes. Coming into the year, we identified Fed policy as a key risk to higher yields. The last time the Fed was in the position to reduce/taper its bond purchases, then-Chairman Ben Bernanke surprised markets by casually mentioning that the Fed would start to taper its bond-buying programs in the coming months. His comments caught equity and fixed income investors by surprise and both markets reacted negatively—although the equity markets went on to return 30% for the year. While we are in a similar situation today with the Fed likely to formally announce its intentions to taper its bond-buying programs soon, the markets have no reason to be surprised. The Fed has been communicating its intentions to eventually taper bond purchases for several months now. Markets should be well prepared at this point as the Fed learned its lesson from 2013 and has done a much better job communicating its intentions. As such, we do not envision another “taper tantrum” event that causes interest rates to spike higher.
Conclusion
Near-term inflation expectations above historical trends, less involvement in the bond market by the Fed, and improving growth expectations once the Delta variant recedes are all reasons why we believe interest rates will move moderately higher from current levels. We expect the 10-year Treasury yield to end the year between 1.50% and 1.75%. We may see even higher yields next year, but an aging global demographic that needs income, higher global debt levels, and an ongoing bull market in equities (which potentially means more frequent rebalancing into fixed income) may keep interest rates from going substantially higher in 2022 as well. Read previous editions of Weekly Market Commentary on lpl.com at News & Media. Lawrence Gillum, CFA, Fixed Income Strategist, LPL Financial
Ryan Detrick, CMT, Chief Market Strategist, LPL Financial ______________________________________________________________________________________________ IMPORTANT DISCLOSURES This material is for general information only and is not intended to provide specific advice or recommendations for any individual. There is no assurance that the views or strategies discussed are suitable for all investors or will yield positive outcomes. Investing involves risks including possible loss of principal. Any economic forecasts set forth may not develop as predicted and are subject to change. References to markets, asset classes, and sectors are generally regarding the corresponding market index. Indexes are unmanaged statistical composites and cannot be invested into directly. Index performance is not indicative of the performance of any investment and do not reflect fees, expenses, or sales charges. All performance referenced is historical and is no guarantee of future results. Any company names noted herein are for educational purposes only and not an indication of trading intent or a solicitation of their products or services. LPL Financial doesn’t provide research on individual equities. All information is believed to be from reliable sources; however, LPL Financial makes no representation as to its completeness or accuracy. US Treasuries may be considered “safe haven” investments but do carry some degree of risk including interest rate, credit, and market risk. Bonds are subject to market and interest rate risk if sold prior to maturity. Bond values will decline as interest rates rise and bonds are subject to availability and change in price. The Standard & Poor’s 500 Index (S&P500) is a capitalization-weighted index of 500 stocks designed to measure performance of the broad domestic economy through changes in the aggregate market value of 500 stocks representing all major industries. The PE ratio (price-to-earnings ratio) is a measure of the price paid for a share relative to the annual net income or profit earned by the firm per share. It is a financial ratio used for valuation: a higher PE ratio means that investors are paying more for each unit of net income, so the stock is more expensive compared to one with lower PE ratio. Earnings per share (EPS) is the portion of a company’s profit allocated to each outstanding share of common stock. EPS serves as an indicator of a company’s profitability. Earnings per share is generally considered to be the single most important variable in determining a share’s price. It is also a major component used to calculate the price-to-earnings valuation ratio. All index data from FactSet. Please read the full Midyear Outlook 2021: Picking Up Speed publication for additional description and disclosure. This research material has been prepared by LPL Financial LLC. Securities and advisory services offered through LPL Financial (LPL), a registered investment advisor and broker-dealer (member FINRA/SIPC). Insurance products are offered through LPL or its licensed affiliates. To the extent you are receiving investment advice from a separately registered independent investment advisor that is not an LPL affiliate, please note LPL makes no representation with respect to such entity. Not Insured by FDIC/NCUA or Any Other Government Agency | Not Bank/Credit Union Guaranteed | Not Bank/Credit Union Deposits or Obligations | May Lose Value
RES-894867-0921 | For Public Use | Tracking # 1-05191527 (Exp. 09/22)