What to Watch This Earnings Season
First quarter earnings season is rolling. BlackRock, Delta Airlines, Goldman Sachs, JPMorgan Chase, and Morgan Stanley were among the first 16 S&P 500 companies to report March quarter results, following 20 index constituents with quarters ending in February that had already reported. Below we preview earnings season, highlight what we are watching, and share our latest thoughts on the 2022 profit outlook.
 Pressure on profit margins from higher costs for virtually everything, notably labor, materials, and transportation, made this quarter difficult to navigate. Add spillover from the Russia-Ukraine conflict and intermittent COVID-19 lockdowns in China, and companies’ bottom lines are getting hit from several directions. Despite the tough environment, we believe the odds favor companies beating estimates as they have done historically on the back of double-digit revenue growth. High inflation translates into more revenue so earnings can grow at a solid pace even with some narrowing of profit margins. LPL Research expects S&P 500 revenue for the first quarter to rise 11% year over year, with energy and healthcare making the biggest contributions. Energy sector earnings are expected to contribute 5 percentage points of growth for the S&P 500—basically all of it based on current consensus estimates—and roughly 3 percentage points of revenue growth. Still, we probably will not get the 8 percentage points of upside S&P 500 companies delivered in the fourth quarter of 2021. Inflation, COVID-19, and geopolitical challenges have dampened the overall pace of economic activity in recent months and impaired profits. Meanwhile, the percentage of pre-announcing companies taking numbers down, at 70%, is above the five-year average of 60% and signals less potential upside. Nonetheless, upside of 3-4 percentage points seems like a reasonable expectation, or a year-over-year earnings gain of 8-9%.
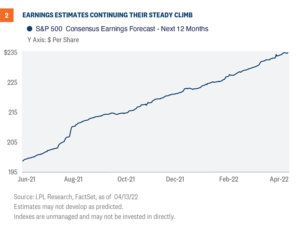
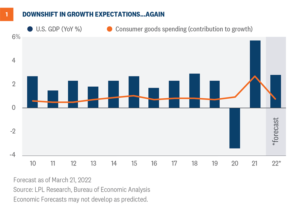
 However, we believe Wall Street’s estimates for 9-10% earnings growth this year are too high given the margin pressures noted above are likely to persist, and we have cut a full percentage point off of our forecasts for U.S. and global gross domestic product (GDP) since January 1. We would view a slight estimate cut during earnings season as a win, especially considering historically estimates are cut by about 3% as companies report results. So while the higher estimates are encouraging, we expect estimates to fall over the next couple quarters, which could lead to more choppiness for markets in the near term.
What to expect
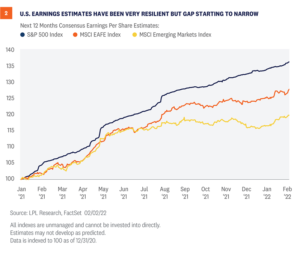
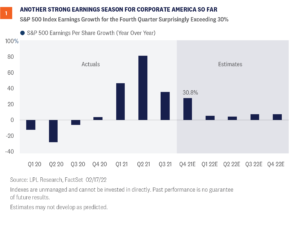
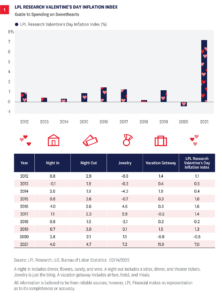
We expect corporate America to again report earnings above consensus estimates in the first quarter. The consensus estimate is now calling for a 5% year-over-year increase in S&P 500 Index earnings per share, not an easy target by any stretch [Figure 1]. Pressure on profit margins from higher costs for virtually everything, notably labor, materials, and transportation, made this quarter difficult to navigate. Add spillover from the Russia-Ukraine conflict and intermittent COVID-19 lockdowns in China, and companies’ bottom lines are getting hit from several directions. Despite the tough environment, we believe the odds favor companies beating estimates as they have done historically on the back of double-digit revenue growth. High inflation translates into more revenue so earnings can grow at a solid pace even with some narrowing of profit margins. LPL Research expects S&P 500 revenue for the first quarter to rise 11% year over year, with energy and healthcare making the biggest contributions. Energy sector earnings are expected to contribute 5 percentage points of growth for the S&P 500—basically all of it based on current consensus estimates—and roughly 3 percentage points of revenue growth. Still, we probably will not get the 8 percentage points of upside S&P 500 companies delivered in the fourth quarter of 2021. Inflation, COVID-19, and geopolitical challenges have dampened the overall pace of economic activity in recent months and impaired profits. Meanwhile, the percentage of pre-announcing companies taking numbers down, at 70%, is above the five-year average of 60% and signals less potential upside. Nonetheless, upside of 3-4 percentage points seems like a reasonable expectation, or a year-over-year earnings gain of 8-9%.What to Watch
Here are three things we are watching this earnings season—all inflation related—to help assess the near-term earnings outlook:- Margin pressures. This one is going to be highlighted in our earnings previews for a while. We will continue to watch for signs of pressure on profit margins from rising wages, costs of materials, energy, and transportation. Companies defied the skeptics (including ourselves) and held margins fairly steady in the fourth quarter. Market participants appear to be braced for lower margins in the first quarter so markets may not react negatively to modest deterioration—our expectation.
- Pricing power. The inflationary environment has brought pricing power to many companies along with more revenue for commodity producers. This is evident in the double-digit revenue growth S&P 500 companies are expected to produce for the quarter. If companies are able to pass through their higher costs as they generally did in the fourth quarter, they should be able to hit their earnings targets pretty easily this quarter.
- Supply chain status. Companies generally communicated that they expected most supply chain issues to be resolved by mid-2022, which now appears overly optimistic. While the progress toward containing COVID-19 is encouraging in the United States, China’s failures are keeping global supply chains snarled longer than many companies had anticipated.
Early thoughts on 2022 earnings
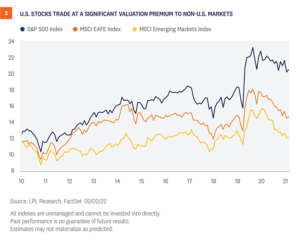
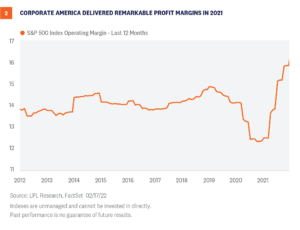
S&P 500 earnings estimates for 2022 have risen 2.2% this year to $228.50 per share (source: FactSet), which is remarkable considering how difficult the operating environment has become. We have sharply higher inflation, slower global growth, dampened consumer confidence, and a devastating war in Eastern Europe. Through that, analysts’ profit targets are rising, which means our $220 per share forecast for 2022 S&P 500 earnings (6-7% growth) is probably too low. The consensus estimate for the next 12 months is up to $235 per share, in line with our forecast for calendar 2023 [Figure 2]. However, we believe Wall Street’s estimates for 9-10% earnings growth this year are too high given the margin pressures noted above are likely to persist, and we have cut a full percentage point off of our forecasts for U.S. and global gross domestic product (GDP) since January 1. We would view a slight estimate cut during earnings season as a win, especially considering historically estimates are cut by about 3% as companies report results. So while the higher estimates are encouraging, we expect estimates to fall over the next couple quarters, which could lead to more choppiness for markets in the near term.
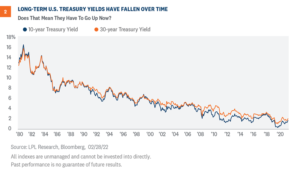

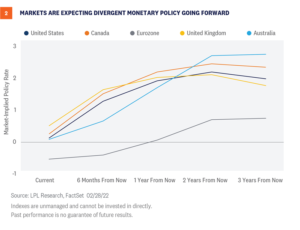 Our view remains that interest rate hikes for the U.S. will likely begin in March with a 25 basis point (0.25%) hike and then three to four more rate hikes at subsequent meetings in 2022. Moreover, we think the Fed will start to reduce its nearly $9 trillion balance sheet in the second half of 2022. There is a risk to the upside (in hikes) depending on the trajectory of inflationary pressures. If consumer price pressures moderate over the course of the year, as we and the Fed expect, then we think the Fed and other central bankers can take a more moderate approach to interest rate hikes. However, if inflationary pressures remain stubbornly high and, importantly, we start to see longer-term inflation expectations become unanchored, central bankers may be forced to move more aggressively than what is already priced in. That said, given the current conflict in the Ukraine, there remains considerable near term uncertainty with central bank intentions. Additionally, upward pressure on commodity prices, already impacted by COVID-19-related supply chain disruptions, may see a more sustained impact as economic sanctions play out and will probably be the main source of risk for possible broader economic repercussions. As such, inflationary pressures may remain high particularly as it relates to gas prices. Finally, and we can’t stress this enough, these views and opinions are secondary to the conflict taking place in Ukraine. While our primary job is to provide investment advice, we certainly recognize that there is an immediate humanitarian crisis taking place in eastern Europe. We hope the conflict ends quickly and offer our thoughts to those impacted. Lawrence Gillum, CFA, Fixed Income Strategist, LPL Financial Ryan Detrick, CMT, Chief Market Strategist, LPL Financial ______________________________________________________________________________________________ IMPORTANT DISCLOSURES This material is for general information only and is not intended to provide specific advice or recommendations for any individual. There is no assurance that the views or strategies discussed are suitable for all investors or will yield positive outcomes. Investing involves risks including possible loss of principal. Any economic forecasts set forth may not develop as predicted and are subject to change. References to markets, asset classes, and sectors are generally regarding the corresponding market index. Indexes are unmanaged statistical composites and cannot be invested into directly. Index performance is not indicative of the performance of any investment and do not reflect fees, expenses, or sales charges. All performance referenced is historical and is no guarantee of future results. Any company names noted herein are for educational purposes only and not an indication of trading intent or a solicitation of their products or services. LPL Financial doesn’t provide research on individual equities. All information is believed to be from reliable sources; however, LPL Financial makes no representation as to its completeness or accuracy. US Treasuries may be considered “safe haven” investments but do carry some degree of risk including interest rate, credit, and market risk. Bonds are subject to market and interest rate risk if sold prior to maturity. Bond values will decline as interest rates rise and bonds are subject to availability and change in price. The Standard & Poor’s 500 Index (S&P500) is a capitalization-weighted index of 500 stocks designed to measure performance of the broad domestic economy through changes in the aggregate market value of 500 stocks representing all major industries. The PE ratio (price-to-earnings ratio) is a measure of the price paid for a share relative to the annual net income or profit earned by the firm per share. It is a financial ratio used for valuation: a higher PE ratio means that investors are paying more for each unit of net income, so the stock is more expensive compared to one with lower PE ratio. Earnings per share (EPS) is the portion of a company’s profit allocated to each outstanding share of common stock. EPS serves as an indicator of a company’s profitability. Earnings per share is generally considered to be the single most important variable in determining a share’s price. It is also a major component used to calculate the price-to-earnings valuation ratio. All index data from FactSet. This research material has been prepared by LPL Financial LLC. Securities and advisory services offered through LPL Financial (LPL), a registered investment advisor and broker-dealer (member FINRA/SIPC). Insurance products are offered through LPL or its licensed affiliates. To the extent you are receiving investment advice from a separately registered independent investment advisor that is not an LPL affiliate, please note LPL makes no representation with respect to such entity. Not Insured by FDIC/NCUA or Any Other Government Agency | Not Bank/Credit Union Guaranteed | Not Bank/Credit Union Deposits or Obligations | May Lose Value
RES-1066650-0222 | For Public Use | Tracking # 1-05248727 (Exp. 2/23)
Our view remains that interest rate hikes for the U.S. will likely begin in March with a 25 basis point (0.25%) hike and then three to four more rate hikes at subsequent meetings in 2022. Moreover, we think the Fed will start to reduce its nearly $9 trillion balance sheet in the second half of 2022. There is a risk to the upside (in hikes) depending on the trajectory of inflationary pressures. If consumer price pressures moderate over the course of the year, as we and the Fed expect, then we think the Fed and other central bankers can take a more moderate approach to interest rate hikes. However, if inflationary pressures remain stubbornly high and, importantly, we start to see longer-term inflation expectations become unanchored, central bankers may be forced to move more aggressively than what is already priced in. That said, given the current conflict in the Ukraine, there remains considerable near term uncertainty with central bank intentions. Additionally, upward pressure on commodity prices, already impacted by COVID-19-related supply chain disruptions, may see a more sustained impact as economic sanctions play out and will probably be the main source of risk for possible broader economic repercussions. As such, inflationary pressures may remain high particularly as it relates to gas prices. Finally, and we can’t stress this enough, these views and opinions are secondary to the conflict taking place in Ukraine. While our primary job is to provide investment advice, we certainly recognize that there is an immediate humanitarian crisis taking place in eastern Europe. We hope the conflict ends quickly and offer our thoughts to those impacted. Lawrence Gillum, CFA, Fixed Income Strategist, LPL Financial Ryan Detrick, CMT, Chief Market Strategist, LPL Financial ______________________________________________________________________________________________ IMPORTANT DISCLOSURES This material is for general information only and is not intended to provide specific advice or recommendations for any individual. There is no assurance that the views or strategies discussed are suitable for all investors or will yield positive outcomes. Investing involves risks including possible loss of principal. Any economic forecasts set forth may not develop as predicted and are subject to change. References to markets, asset classes, and sectors are generally regarding the corresponding market index. Indexes are unmanaged statistical composites and cannot be invested into directly. Index performance is not indicative of the performance of any investment and do not reflect fees, expenses, or sales charges. All performance referenced is historical and is no guarantee of future results. Any company names noted herein are for educational purposes only and not an indication of trading intent or a solicitation of their products or services. LPL Financial doesn’t provide research on individual equities. All information is believed to be from reliable sources; however, LPL Financial makes no representation as to its completeness or accuracy. US Treasuries may be considered “safe haven” investments but do carry some degree of risk including interest rate, credit, and market risk. Bonds are subject to market and interest rate risk if sold prior to maturity. Bond values will decline as interest rates rise and bonds are subject to availability and change in price. The Standard & Poor’s 500 Index (S&P500) is a capitalization-weighted index of 500 stocks designed to measure performance of the broad domestic economy through changes in the aggregate market value of 500 stocks representing all major industries. The PE ratio (price-to-earnings ratio) is a measure of the price paid for a share relative to the annual net income or profit earned by the firm per share. It is a financial ratio used for valuation: a higher PE ratio means that investors are paying more for each unit of net income, so the stock is more expensive compared to one with lower PE ratio. Earnings per share (EPS) is the portion of a company’s profit allocated to each outstanding share of common stock. EPS serves as an indicator of a company’s profitability. Earnings per share is generally considered to be the single most important variable in determining a share’s price. It is also a major component used to calculate the price-to-earnings valuation ratio. All index data from FactSet. This research material has been prepared by LPL Financial LLC. Securities and advisory services offered through LPL Financial (LPL), a registered investment advisor and broker-dealer (member FINRA/SIPC). Insurance products are offered through LPL or its licensed affiliates. To the extent you are receiving investment advice from a separately registered independent investment advisor that is not an LPL affiliate, please note LPL makes no representation with respect to such entity. Not Insured by FDIC/NCUA or Any Other Government Agency | Not Bank/Credit Union Guaranteed | Not Bank/Credit Union Deposits or Obligations | May Lose Value
RES-1066650-0222 | For Public Use | Tracking # 1-05248727 (Exp. 2/23)