Relief at the Pump and for Portfolios?
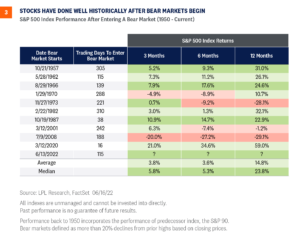
2022 has been rough all-around for the American consumer. Not only are we battling decades-high inflation, but investors’ portfolios are off to one of the worst starts to a year in history as we near the halfway point. Our technical work is first and foremost rooted in trend following, and the trend in both stock and bond prices so far this year have of course been down. However, one trend that has been strongly higher is energy prices. It may be early, but we see some potential signs that energy trends could be changing, which would not only have positive implications for consumers’ wallets, but also potentially investors’ investment portfolios.
 Don’t forget that what matters to consumers also matters to politicians. President Biden’s approval rating has continued to decline amid higher inflation numbers, with a near perfect inverse correlation to gas prices. That has implications for the midterm elections, where Republicans will look to capitalize on inflation and spin their energy policies as the solution. Currently, betting markets show about 3:1 odds that Republicans will be able to take control of both the House of Representatives and the Senate in November.
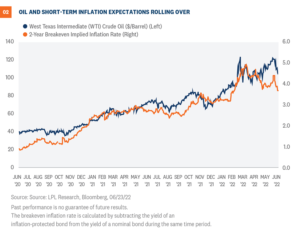
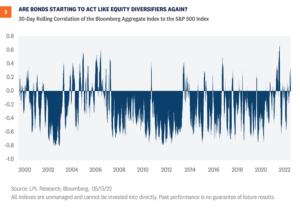
 To be clear, we do believe that fundamentals still matter, but it would be naïve to suggest that the Federal Reserve (Fed) and the potential path of its rate hikes have not been the primary focus of short-term market moves this year, and so far, that shows little signs of changing. Any shift towards a more dovish Fed, whether it be from economic weakness or lowered inflation expectations, is almost certain to be a positive for bonds, which have fallen dramatically amid the latest surge in inflation and skyrocketing interest rates, but may also be a positive for equities which seemed potentially already priced for a recession.
Gas prices hit record highs
Let’s start with the single price that matters to consumers most: gas prices. Even if you drive an electric car, it would be hard not to notice the huge increase in gas prices over the past year. As shown in Figure 1, the AAA national average price for a gallon of gasoline just hit $5 for the first time ever. For many Americans, the amount of gasoline they need is simply fixed, as they must drive to work, school, etc. So when prices rise, the money has to come from somewhere else, and it should therefore come as no surprise that the consumer discretionary sector is the worst performing S&P 500 Index sector year-to-date with a more than 30% loss. Don’t forget that what matters to consumers also matters to politicians. President Biden’s approval rating has continued to decline amid higher inflation numbers, with a near perfect inverse correlation to gas prices. That has implications for the midterm elections, where Republicans will look to capitalize on inflation and spin their energy policies as the solution. Currently, betting markets show about 3:1 odds that Republicans will be able to take control of both the House of Representatives and the Senate in November.Energy policy remains a wild card
To be sure, the Biden administration, while focused squarely on its policy of transitioning the economy towards a non-fossil fuel environment, has been trying to alleviate the burden of rising gasoline and diesel prices by trying to introduce a federal gasoline tax holiday. The administration wants the federal tax holiday, which would take 18.4 cents off a gallon of gasoline, to be introduced along with a state tax holiday. A tax break from both state and federal governments is expected to give consumers approximately $30 of savings per month for one weekly fill-up. The breakdown in savings comes from the 18.4 cents per gallon for the federal tax and 31 cents per gallon on average from state governments. The tax holiday, which would last for three months, needs congressional approval, and so far, despite intense lobbying efforts, approval doesn’t appear forthcoming. In addition, the administration has become increasingly vocal in encouraging energy companies to increase drilling, while an upcoming presidential visit to Saudi Arabia is being highlighted as an opportunity to discuss measures to foster peace in the Middle East. Still, given that Saudi Arabia is the de facto leader of OPEC, the goals of the visit undoubtedly include an attempt to return with an agreement for higher oil production levels. OPEC, despite raising production levels in July and August, is seemingly intent on keeping prices high as member countries recover from the drought of demand incurred by the pandemic. Ironically, although lower gasoline prices could encourage more consumer discretionary spending, it could also lead to more travel by car, exactly the opposite of what’s needed to help bring down inflation. A long-term solution still remains unclear, as the low oil price environment that has reigned over much of the past eight years has consistently punished American oil companies for investment and rewarded more shareholder-friendly policies such as dividends and share buybacks. Still, the all-important U.S. consumer needs a break regardless of how it’s delivered.Energy prices drive inflation expectations
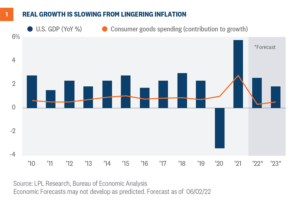
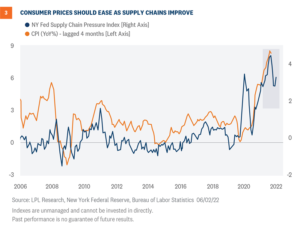
Nothing we have addressed so far is especially positive, so let’s get to that part. While the gasoline prices shown in Figure 1 are just pennies removed from those all-time highs, gas prices at the pump tend to operate on a lag from real world commodity prices. In the past few weeks, the price of West Texas Intermediate (WTI) crude oil has fallen approximately 15%, losing a technical support level we believed would hold near $115/barrel. While the trend in most energy/oil prices is still higher from a long-term perspective, numerous other commodities that have experienced strong bullish runs appear to be more clearly breaking down, so the odds of a top in oil prices may be higher than just the chart itself suggests. As global central banks fight inflationary pressures around the globe with rate hikes, the result has been a perception that the economy will not be able to withstand continued tightening of financial conditions and will fall into a marked slowdown, if not an all-out recession. For instance copper, often referred to as Dr. Copper for its ability to forecast economic conditions, just hit its lowest level since February 2021. That in and of itself isn’t a positive, but as shown in Figure 2, market-based inflation expectations are highly correlated with commodities, especially oil, and those also appear to be rolling over recently, with the two-year breakeven implied inflation rate recently hitting its lowest level in four months. To be clear, we do believe that fundamentals still matter, but it would be naïve to suggest that the Federal Reserve (Fed) and the potential path of its rate hikes have not been the primary focus of short-term market moves this year, and so far, that shows little signs of changing. Any shift towards a more dovish Fed, whether it be from economic weakness or lowered inflation expectations, is almost certain to be a positive for bonds, which have fallen dramatically amid the latest surge in inflation and skyrocketing interest rates, but may also be a positive for equities which seemed potentially already priced for a recession.