LPL Research’s Sustainable Investing Year in Review
Sustainable investing hit several milestones in 2021, but continued to attract its critics. Below we look at how sustainable investing fits within the broader concept of sustainability, its growth during 2021, and an implementation framework that has been helpful for many. A well diversified sustainable investing portfolio doesn’t mean that an investor has to make a choice between achieving market-like returns and being an aware social and environmental steward. Market volatility has been the dominant story for many investors in early 2022, but even as we focus on near term events it’s important to continue to track important market trends. Sustainable investing has become a significant theme in how many investors choose to direct some or all of their capital, choosing to emphasize businesses that show they’re in it for the long term. The space has been evolving as it continues to meet its critics and address the challenges that come with growth, with several important developments in 2021.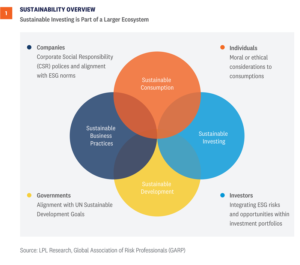

 The universe of sustainable investing mutual funds and ETFs has also continued to grow since the first fund was launched in 1971 [Figure 3]. The growth in available options provides investors with a spectrum of choices, from being able to build a diversified stock and bond portfolio, to selecting a specialized strategy to supplement a traditional diversified portfolio. In 2021, the number of available choices grew 44% to 560.
  As a wider range of investors continue to incorporate sustainable investing in their investment process, there’s been a growing trend of traditional investment strategies being repurposed as sustainable investing strategies [Figure 4]. During 2021, 45 funds were repurposed while 125 funds were launched. The implication for investors is the need to thoroughly vet strategies to ensure the investment is delivering on the claims made in its supporting literature.
 Jason Hoody, CFA, Head of Investment Manager Research & Sustainable Investing Research, LPL Financial ______________________________________________________________________________________________ IMPORTANT DISCLOSURES This material is for general information only and is not intended to provide specific advice or recommendations for any individual. There is no assurance that the views or strategies discussed are suitable for all investors or will yield positive outcomes. Investing involves risks including possible loss of principal. Any economic forecasts set forth may not develop as predicted and are subject to change. References to markets, asset classes, and sectors are generally regarding the corresponding market index. Indexes are unmanaged statistical composites and cannot be invested into directly. Index performance is not indicative of the performance of any investment and does not reflect fees, expenses, or sales charges. All performance referenced is historical and is no guarantee of future results. Any company names noted herein are for educational purposes only and not an indication of trading intent or a solicitation of their products or services. LPL Financial doesn’t provide research on individual equities. All information is believed to be from reliable sources; however, LPL Financial makes no representation as to its completeness or accuracy. An Environmental, Social and Governance (ESG) fund’s policy could cause it to perform differently compared to funds that do not have such a policy. The application of social and environmental standards may affect a fund’s exposure to certain issuers, industries, sectors, and factors that may impact relative financial performance — positively or negatively — depending on whether such investments are in or out of favor. U.S. Treasuries may be considered “safe haven” investments but do carry some degree of risk including interest rate, credit, and market risk. Bonds are subject to market and interest rate risk if sold prior to maturity. Bond values will decline as interest rates rise and bonds are subject to availability and change in price. The Standard & Poor’s 500 Index (S&P500) is a capitalization-weighted index of 500 stocks designed to measure performance of the broad domestic economy through changes in the aggregate market value of 500 stocks representing all major industries. The PE ratio (price-to-earnings ratio) is a measure of the price paid for a share relative to the annual net income or profit earned by the firm per share. It is a financial ratio used for valuation: a higher PE ratio means that investors are paying more for each unit of net income, so the stock is more expensive compared to one with lower PE ratio. Earnings per share (EPS) is the portion of a company’s profit allocated to each outstanding share of common stock. EPS serves as an indicator of a company’s profitability. Earnings per share is generally considered to be the single most important variable in determining a share’s price. It is also a major component used to calculate the price-to-earnings valuation ratio. All index data from FactSet. This research material has been prepared by LPL Financial LLC. Securities and advisory services offered through LPL Financial (LPL), a registered investment advisor and broker-dealer (member FINRA/SIPC). Insurance products are offered through LPL or its licensed affiliates. To the extent you are receiving investment advice from a separately registered independent investment advisor that is not an LPL affiliate, please note LPL makes no representation with respect to such entity. Not Insured by FDIC/NCUA or Any Other Government Agency | Not Bank/Credit Union Guaranteed | Not Bank/Credit Union Deposits or Obligations | May Lose Value
RES-1023100-0122 | For Public Use | Tracking # 1-05238004 (Exp. 1/23)
Jason Hoody, CFA, Head of Investment Manager Research & Sustainable Investing Research, LPL Financial ______________________________________________________________________________________________ IMPORTANT DISCLOSURES This material is for general information only and is not intended to provide specific advice or recommendations for any individual. There is no assurance that the views or strategies discussed are suitable for all investors or will yield positive outcomes. Investing involves risks including possible loss of principal. Any economic forecasts set forth may not develop as predicted and are subject to change. References to markets, asset classes, and sectors are generally regarding the corresponding market index. Indexes are unmanaged statistical composites and cannot be invested into directly. Index performance is not indicative of the performance of any investment and does not reflect fees, expenses, or sales charges. All performance referenced is historical and is no guarantee of future results. Any company names noted herein are for educational purposes only and not an indication of trading intent or a solicitation of their products or services. LPL Financial doesn’t provide research on individual equities. All information is believed to be from reliable sources; however, LPL Financial makes no representation as to its completeness or accuracy. An Environmental, Social and Governance (ESG) fund’s policy could cause it to perform differently compared to funds that do not have such a policy. The application of social and environmental standards may affect a fund’s exposure to certain issuers, industries, sectors, and factors that may impact relative financial performance — positively or negatively — depending on whether such investments are in or out of favor. U.S. Treasuries may be considered “safe haven” investments but do carry some degree of risk including interest rate, credit, and market risk. Bonds are subject to market and interest rate risk if sold prior to maturity. Bond values will decline as interest rates rise and bonds are subject to availability and change in price. The Standard & Poor’s 500 Index (S&P500) is a capitalization-weighted index of 500 stocks designed to measure performance of the broad domestic economy through changes in the aggregate market value of 500 stocks representing all major industries. The PE ratio (price-to-earnings ratio) is a measure of the price paid for a share relative to the annual net income or profit earned by the firm per share. It is a financial ratio used for valuation: a higher PE ratio means that investors are paying more for each unit of net income, so the stock is more expensive compared to one with lower PE ratio. Earnings per share (EPS) is the portion of a company’s profit allocated to each outstanding share of common stock. EPS serves as an indicator of a company’s profitability. Earnings per share is generally considered to be the single most important variable in determining a share’s price. It is also a major component used to calculate the price-to-earnings valuation ratio. All index data from FactSet. This research material has been prepared by LPL Financial LLC. Securities and advisory services offered through LPL Financial (LPL), a registered investment advisor and broker-dealer (member FINRA/SIPC). Insurance products are offered through LPL or its licensed affiliates. To the extent you are receiving investment advice from a separately registered independent investment advisor that is not an LPL affiliate, please note LPL makes no representation with respect to such entity. Not Insured by FDIC/NCUA or Any Other Government Agency | Not Bank/Credit Union Guaranteed | Not Bank/Credit Union Deposits or Obligations | May Lose Value
RES-1023100-0122 | For Public Use | Tracking # 1-05238004 (Exp. 1/23)
What is Sustainability?
The concept of sustainability can easily get bogged down in confusing definitions and minutia. Most simply, sustainability is humanity meeting its current needs without overburdening the natural environment or future generations. Environmental sustainability refers to maintaining the balance of natural systems and that natural resources are consumed at a rate that can be replenished. Social sustainability refers to a minimum standard of basic necessities and that human rights is afforded to all people. As shown below, sustainability includes action by individuals, companies, governments, and increasingly investors. Environmental, social, and governance (ESG) issues fit within sustainability, but in its broadest sense ESG is a grading system for firms. ESG criteria are used by investors to gauge companies (and increasingly governments) on their ESG performance relative to their peers. Environmental metrics may include a company’s carbon dioxide emissions, water usage, or impact on deforestation. Social metrics may include a company’s employee engagement, diversity and inclusion, and employee health and safety. Governance metrics may include a company’s board composition, executive compensation, and other internal procedures. Sustainable investing incorporates ESG metrics into the investment process to provide greater transparency and help manage ESG risks and opportunities. As illustrated in [Figure 1], sustainable investing is part of a larger effort to provide social and environmental awareness and stewardship.Growth of Sustainable Investing
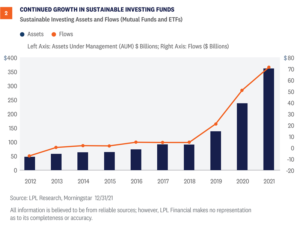
Sustainable investing mutual funds and exchange-traded funds (ETFs) continue to attract record flows from investors [Figure 2]. Determining this universe involves the identification of funds that demonstrate a commitment to ESG considerations in their investment process (disclosed in the principal investment strategies section of their prospectus). As of December 31, 2021, assets grew 52% from the year before to $362 billion. The universe of sustainable investing mutual funds and ETFs has also continued to grow since the first fund was launched in 1971 [Figure 3]. The growth in available options provides investors with a spectrum of choices, from being able to build a diversified stock and bond portfolio, to selecting a specialized strategy to supplement a traditional diversified portfolio. In 2021, the number of available choices grew 44% to 560. 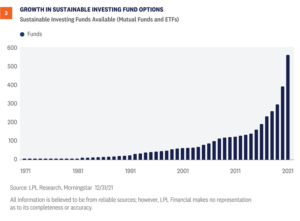 As a wider range of investors continue to incorporate sustainable investing in their investment process, there’s been a growing trend of traditional investment strategies being repurposed as sustainable investing strategies [Figure 4]. During 2021, 45 funds were repurposed while 125 funds were launched. The implication for investors is the need to thoroughly vet strategies to ensure the investment is delivering on the claims made in its supporting literature.
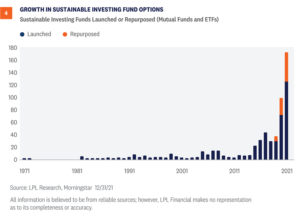
How to Implement Sustainable Investing Strategies
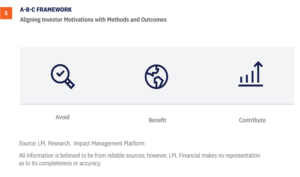
Sustainable investing is not a one-size-fits-all approach as interest varies by investor. For investors, the place to start is to understand their own motivations for their interest in sustainable investing. Motivations for sustainable investing are often grouped into values alignment, financial performance, and impact. Once motivations are clear, they can then be mapped to one or all of the outcomes described below. Finding a strategy or two, becoming more aware of various approaches, and slowly increasing one’s exposure to sustainable investing is a common way to get started.Act to Avoid Harm: Values Alignment
Example: investors can signal that responsible corporate behavior matters.- “I don’t want to support companies that harm the environment, violate human rights, or engage in unfair labor practices.”
Benefit Stakeholders: Financial Performance
Example: investors can engage actively to improve ESG performance of companies.- “I want companies to have a positive effect on society.”
Contribute to Solutions: Impact
Example: investors can supply capital to underserved communities.- “I want to help tackle the affordable housing gap.”
Jason Hoody, CFA, Head of Investment Manager Research & Sustainable Investing Research, LPL Financial ______________________________________________________________________________________________ IMPORTANT DISCLOSURES This material is for general information only and is not intended to provide specific advice or recommendations for any individual. There is no assurance that the views or strategies discussed are suitable for all investors or will yield positive outcomes. Investing involves risks including possible loss of principal. Any economic forecasts set forth may not develop as predicted and are subject to change. References to markets, asset classes, and sectors are generally regarding the corresponding market index. Indexes are unmanaged statistical composites and cannot be invested into directly. Index performance is not indicative of the performance of any investment and does not reflect fees, expenses, or sales charges. All performance referenced is historical and is no guarantee of future results. Any company names noted herein are for educational purposes only and not an indication of trading intent or a solicitation of their products or services. LPL Financial doesn’t provide research on individual equities. All information is believed to be from reliable sources; however, LPL Financial makes no representation as to its completeness or accuracy. An Environmental, Social and Governance (ESG) fund’s policy could cause it to perform differently compared to funds that do not have such a policy. The application of social and environmental standards may affect a fund’s exposure to certain issuers, industries, sectors, and factors that may impact relative financial performance — positively or negatively — depending on whether such investments are in or out of favor. U.S. Treasuries may be considered “safe haven” investments but do carry some degree of risk including interest rate, credit, and market risk. Bonds are subject to market and interest rate risk if sold prior to maturity. Bond values will decline as interest rates rise and bonds are subject to availability and change in price. The Standard & Poor’s 500 Index (S&P500) is a capitalization-weighted index of 500 stocks designed to measure performance of the broad domestic economy through changes in the aggregate market value of 500 stocks representing all major industries. The PE ratio (price-to-earnings ratio) is a measure of the price paid for a share relative to the annual net income or profit earned by the firm per share. It is a financial ratio used for valuation: a higher PE ratio means that investors are paying more for each unit of net income, so the stock is more expensive compared to one with lower PE ratio. Earnings per share (EPS) is the portion of a company’s profit allocated to each outstanding share of common stock. EPS serves as an indicator of a company’s profitability. Earnings per share is generally considered to be the single most important variable in determining a share’s price. It is also a major component used to calculate the price-to-earnings valuation ratio. All index data from FactSet. This research material has been prepared by LPL Financial LLC. Securities and advisory services offered through LPL Financial (LPL), a registered investment advisor and broker-dealer (member FINRA/SIPC). Insurance products are offered through LPL or its licensed affiliates. To the extent you are receiving investment advice from a separately registered independent investment advisor that is not an LPL affiliate, please note LPL makes no representation with respect to such entity. Not Insured by FDIC/NCUA or Any Other Government Agency | Not Bank/Credit Union Guaranteed | Not Bank/Credit Union Deposits or Obligations | May Lose Value
RES-1023100-0122 | For Public Use | Tracking # 1-05238004 (Exp. 1/23)