Markets are off to a strong start this year, with the S&P 500 Index up about 14% so far. However, most of those gains came early in the year, and many stocks have stagnated over recent months. While we remain overweight on stocks relative to bonds, this week we explore three things that worry us—and could make the market more susceptible to a pullback as we enter the second half of 2021.
Year Two Tends To Be Choppy
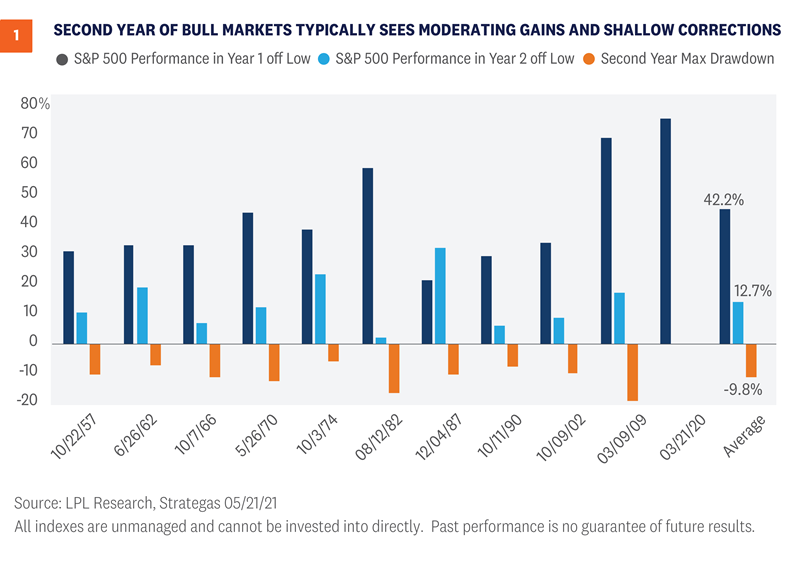
The good news is the second year of every single bull market since World War II has seen the S&P 500 climb higher. That is 12 for 12 for year two gains. The second year for this bull market started on March 23, 2021, and so far, stocks are off to a solid start—up more than 9%. The bad news is for many of the past bull markets, year-two gains were quite muted, as stocks caught their breath from the year-one sprint. With the S&P 500 up more than 90% from the March 23, 2020 lows, we wouldn’t be surprised at all if history repeated and stocks saw choppier action in year two. In fact, taking a closer look at the most recent bull markets it’s clear that a choppy and frustrating path is perfectly normal in year two [Figure 1].
Year two of the 1982 bull market saw flat action in much of 1983 and into early 1984, even as the economy improved.
Year two of the 2003 bull market saw similar choppy action in 2004. There’s an old saying that stocks can correct via time or price. In 2004, stocks simply corrected over time with a choppy sideways move after the big year-one gains.
The 2009 bull market saw a 16% correction during year two in 2010, but stocks managed to consolidate before eventually moving back to new highs by late 2010.
Fewer Stocks Making New Highs
The S&P 500 Index hit a new record high last week, but under the surface fewer stocks have been participating. Just 15% of the stocks in the index hit a new one-month high along with the benchmark on June 24, and for the first time since December 1999, a record closing high occurred with less than half of the stocks in the index above their 50-day moving averages. If the last few years have taught us anything, it should be that the largest technology stocks are capable of powering the S&P 500 to new highs. However, a far healthier and more sustainable trend typically sees stronger participation, like earlier in the year when new highs in the S&P 500 were commonly accompanied by 30-40% of the index hitting new highs as well. To be fair, some of this dynamic is due to rotation under the surface. As interest rates have pulled back recently, value-oriented sectors such as materials, financials and industrials have underperformed and outright declined over the past month. Meanwhile, growth stocks have gained more than 6% in that time, boosted by outperformance from some of the most heavily weighted names in the S&P 500, including Apple, Facebook, Amazon, and Alphabet. And though this rotation can help to mute declines in the broad benchmarks, it may also serve to limit upside potential. As the old saying goes, “play the averages, get average returns.”
Elevated Stock Valuations
Thanks to the strong start to this bull market, stock valuations have become a widespread concern. Although valuations have not historically been good short-term timing tools for investors, when a downside catalyst eventually emerges, a more richly valued stock market tends to sell off more. After a big rally, more optimism is priced in, and that higher bar then opens the door to disappointment. But here’s the other side of the story. Many investors assessing valuations look at the price-to-earnings ratio (PE) and stop there. As shown in [Figure 2], the S&P 500’s PE is now about 21, compared with the long-term average near 17. By that measure, stocks do look overvalued, but we don’t think that metric provides a complete picture. Interest rates should be considered, as they tell us how much companies’ future profits are worth in today’s dollars, and they allow us to compare high stock valuations to even higher bond valuations. To compare stock valuations to bond valuations, we can calculate an equity risk premium, or ERP. This statistic compares the earnings yield on the S&P 500 (the inverse of the P/E) to the 10-year U.S. Treasury yield. Essentially, an ERP compares the earnings generated by stocks to that generated by bonds. As of June 25, based on the consensus 2021 earnings estimate from FactSet, the S&P 500’s ERP is 3.1%. That compared with the long-term average ERP for the index of 0.8% (higher ERPs mean stocks are less expensive relative to bonds). So, while stock valuations look expensive, which could introduce above-average downside risk, they look quite reasonable when low interest rates are factored in.
Conclusion
We remain confident that tactical investors should remain overweight on stocks relative to bonds, but believe it is important to explore risks to that call, especially as the S&P 500 inches closer to our year-end target of 4400-4450. As history shows, year two following a major market low tends to be more volatile, even if the fundamentals seem much sounder than year one. Additional volatility, weaker participation, and high valuations might sound scary, but we believe that any weakness would likely be a buying opportunity, as the economic and earnings environment remain exceptionally strong as we head into the second half of 2021. Please note, there will be no Weekly Market Commentary next week, in observance of the July 4 holiday. Read previous editions of Weekly Market Commentary on lpl.com at News & Media. Ryan Detrick, CMT, Chief Market Strategist, LPL Financial
Jeff Buchbinder, CFA, Equity Strategist, LPL Financial
Scott Brown, CMT, Senior Analyst, LPL Financial ______________________________________________________________________________________________ IMPORTANT DISCLOSURES This material is for general information only and is not intended to provide specific advice or recommendations for any individual. There is no assurance that the views or strategies discussed are suitable for all investors or will yield positive outcomes. Investing involves risks including possible loss of principal. Any economic forecasts set forth may not develop as predicted and are subject to change. References to markets, asset classes, and sectors are generally regarding the corresponding market index. Indexes are unmanaged statistical composites and cannot be invested into directly. Index performance is not indicative of the performance of any investment and do not reflect fees, expenses, or sales charges. All performance referenced is historical and is no guarantee of future results. Any company names noted herein are for educational purposes only and not an indication of trading intent or a solicitation of their products or services. LPL Financial doesn’t provide research on individual equities. All information is believed to be from reliable sources; however, LPL Financial makes no representation as to its completeness or accuracy. US Treasuries may be considered “safe haven” investments but do carry some degree of risk including interest rate, credit, and market risk. Bonds are subject to market and interest rate risk if sold prior to maturity. Bond values will decline as interest rates rise and bonds are subject to availability and change in price. The Standard & Poor’s 500 Index (S&P500) is a capitalization-weighted index of 500 stocks designed to measure performance of the broad domestic economy through changes in the aggregate market value of 500 stocks representing all major industries. The PE ratio (price-to-earnings ratio) is a measure of the price paid for a share relative to the annual net income or profit earned by the firm per share. It is a financial ratio used for valuation: a higher PE ratio means that investors are paying more for each unit of net income, so the stock is more expensive compared to one with lower PE ratio. Earnings per share (EPS) is the portion of a company’s profit allocated to each outstanding share of common stock. EPS serves as an indicator of a company’s profitability. Earnings per share is generally considered to be the single most important variable in determining a share’s price. It is also a major component used to calculate the price-to-earnings valuation ratio. All index data from FactSet. This research material has been prepared by LPL Financial LLC. Securities and advisory services offered through LPL Financial (LPL), a registered investment advisor and broker-dealer (member FINRA/SIPC). Insurance products are offered through LPL or its licensed affiliates. To the extent you are receiving investment advice from a separately registered independent investment advisor that is not an LPL affiliate, please note LPL makes no representation with respect to such entity. Not Insured by FDIC/NCUA or Any Other Government Agency | Not Bank/Credit Union Guaranteed | Not Bank/Credit Union Deposits or Obligations | May Lose Value
RES-800951-0621 | For Public Use | Tracking # 1-05160472 (Exp. 06/22)
Fiscal stimulus, which was central to the market rebound in the last year, may start moving to the sidelines over the rest of 2021 and into 2022 as the recovery continues. Economic growth can compensate for the loss of government checks to households and businesses, but potential tax increases may be more challenging for markets to navigate. Business tax increases, in particular, may gradually pull gains out of markets about equal to their size, but with economic growth supporting corporate earnings, we believe a positive backdrop for equities remains in place. During much of 2020 and early 2021, markets were focused on fiscal policy due to massive government efforts to help bridge the economy past the impact of COVID-19 restrictions. Markets liked stimulus as much in 2020 and 2021 as in 2009, and, to a smaller extent, 2018. Policy will still matter over the rest of 2021 and into 2022, but it will matter far less—despite some important debates going on in Washington. Markets may anticipate an increase in government spending if Congress passes some version of the Biden administration’s Build Back Better (BBB) initiative, but that spending will likely be spread out over almost a decade. The biggest risk may be around taxes, with businesses and wealthy households both facing the prospect of a higher tax burden to pay for BBB and help manage the deficit.
Federal Spending Unlikely To Change Market Trajectory
Much of the approximately $5 trillion in direct COVID-19 related stimulus in 2020 and 2021 did not flow through directly as government spending. Instead, the federal government used its borrowing power to distribute funds to households and businesses. That impact will fade over the reminder of the year but will be replaced by the private economy accelerating. There is some threat of a fiscal headwind from the decline in government largesse, but that headwind will be felt only if the private economy can’t make up the difference and we continue to expect above-average growth well into 2022. Actual government spending is likely to continue to grow, but the rate of growth will not make a large difference to overall output in our more than $20 trillion economy. According to the Bureau of Economic Analysis, federal spending added an average of about 0.15% per year to gross domestic product (GDP) growth between 2000 and 2020, with defense and non-defense spending each contributing about half of that. Federal spending has not contributed more than 0.5% to GDP growth since 1986 and contributed only 0.29% in 2020. COVID-19 stimulus was more about borrowing and writing checks to businesses and households than growth in direct government spending. But even a small contribution to GDP growth can be massive in absolute terms. With proposals for the two pieces of BBB reaching nearly $4 trillion—including $1.8 trillion for the American Families Plan (AFP) and more than $2 trillion for the infrastructure bill (known as the American Jobs Plan or AJP)—higher taxes would be needed to help finance the new initiatives. Let’s be clear though: With a 50/50 Senate (Vice President Kamala Harris breaks ties) and historically slim Democratic majority in the House, we think these final numbers will likely come at $2–2.5 trillion combined, as these initial numbers from the Democrats were a starting point for negotiations.
Taxes May Change Market Path, But Not Direction
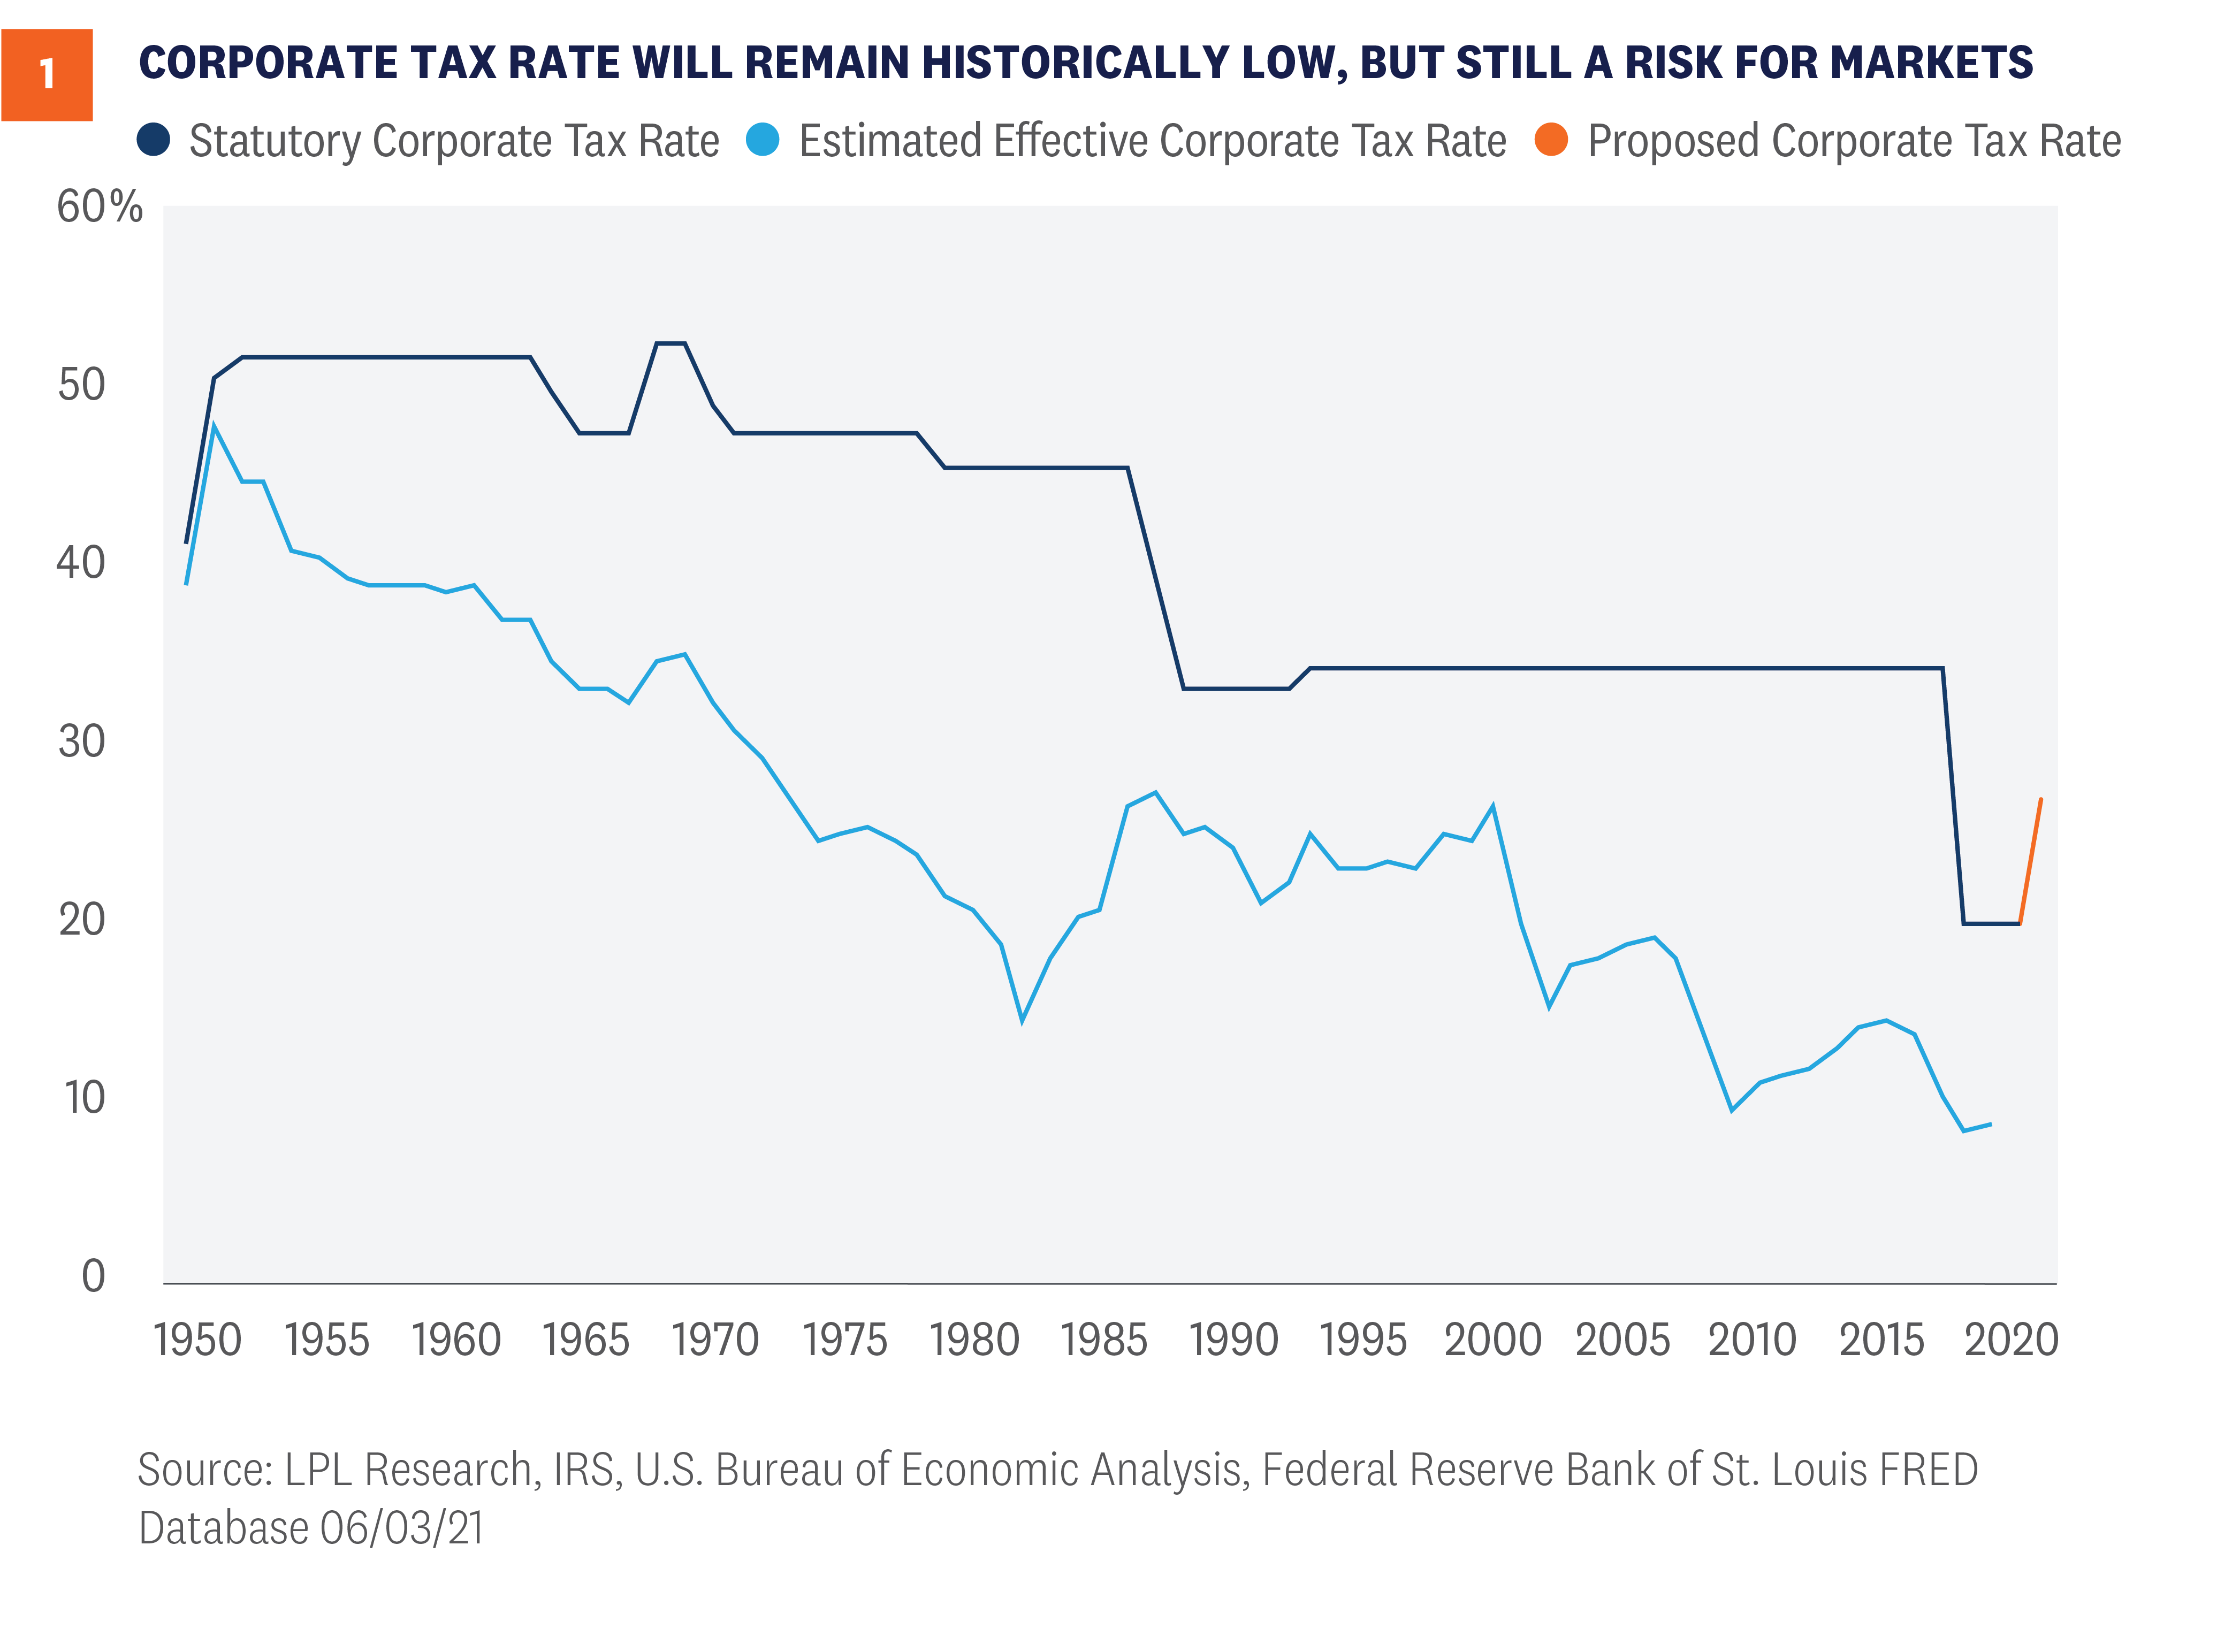
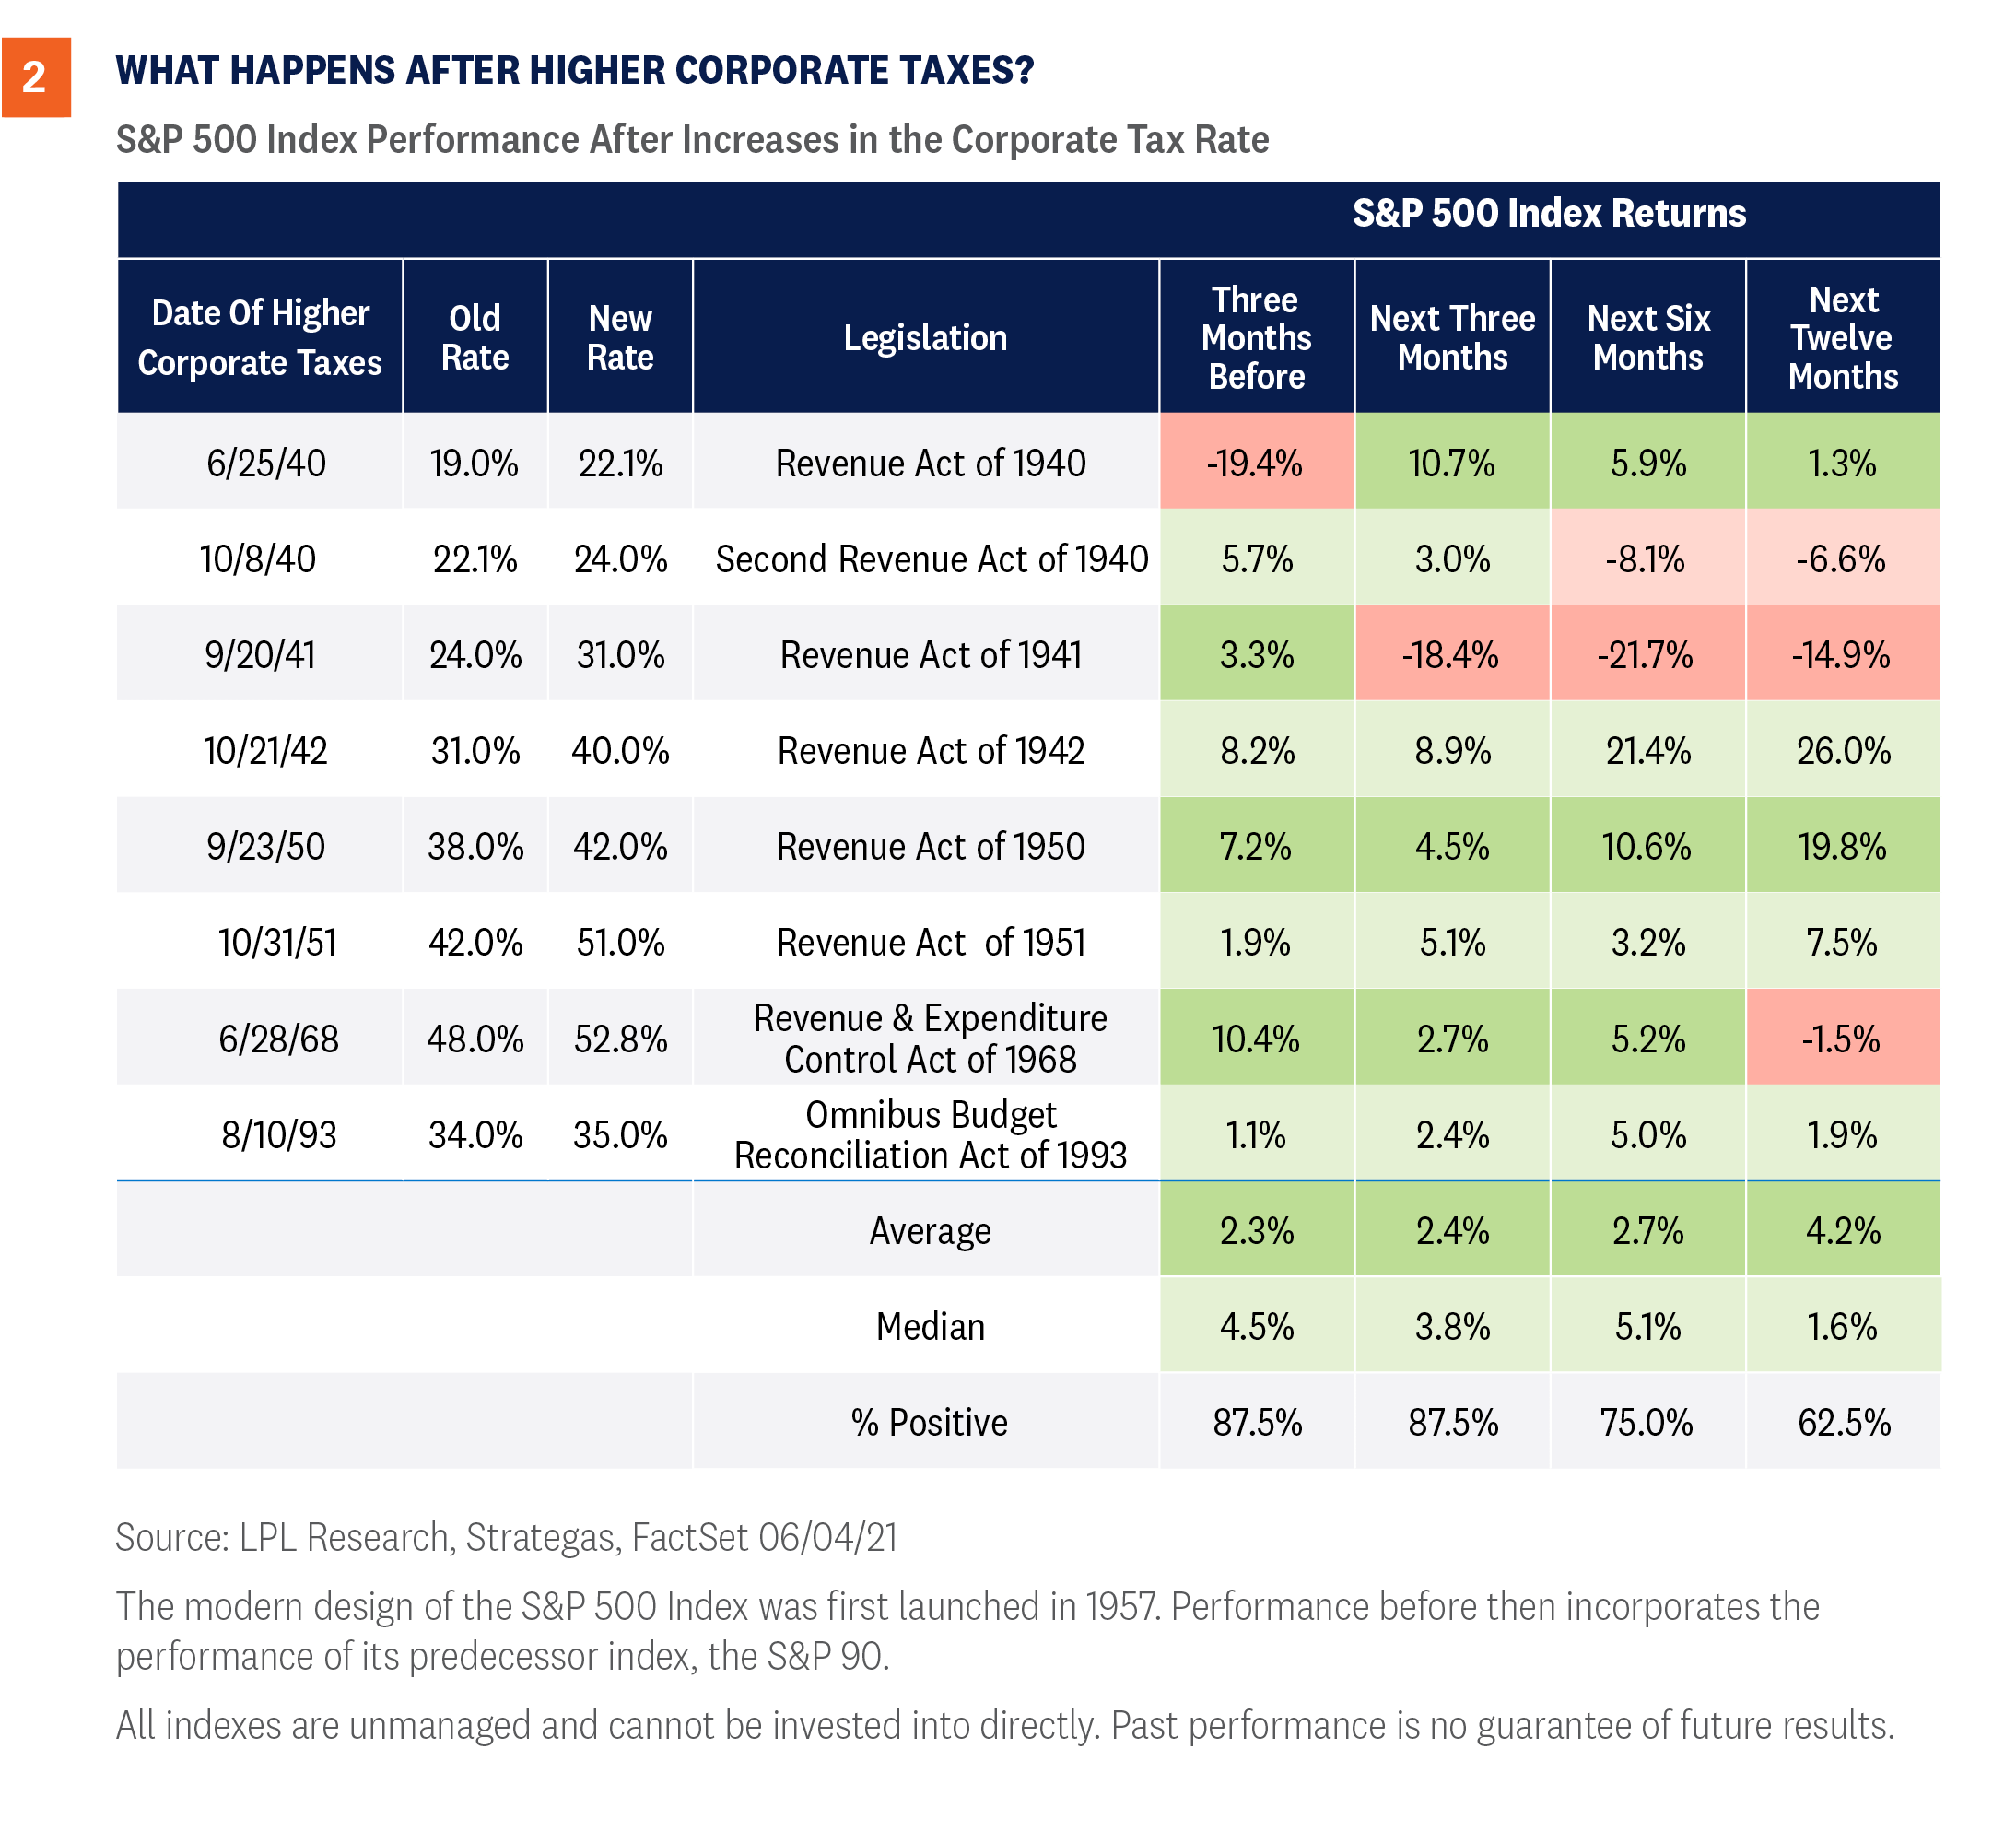
Federal spending is generally funded by taxes or debt, and the Biden administration plans to raise taxes to help pay for BBB. President Biden has proposed increasing taxes on both corporations and wealthy households, including an increase in the capital gains tax, the tax on investment profits. Markets so far have taken the proposed changes in stride, largely due to expectations that the proposed tax increases will be reduced during negotiations and the economy will be strong enough to absorb the impact. The Tax Cuts and Jobs Act (TCJA), signed into law by President Trump in December 2017, reduced the top tax rate on corporations from 35%, where it had been since 1993, to 21%. Before the TCJA, the top U.S. statutory corporate tax rate had not been under 30% since the 1940s. There were also other structural reforms in the TCJA, including changes to the way U.S. corporate profits from abroad are taxed, in an attempt to make U.S. companies more competitive. President Biden has proposed increasing the corporate tax rate to 28%, but that should be viewed as a bargaining position and we believe the more likely outcome is that we see the rate end up closer to 25%. Alternative approaches, such as increasing the minimum tax on businesses and raising the top rate less—or not at all, are becoming part of the conversation. The negative news for markets is that corporate earnings growth will likely take a direct hit that is approximately equal to the size of any tax hike. Because the stock market is fundamentally driven by earnings growth, the tax impact will likely be a headwind for equity markets. On the positive side, this move has been anticipated for quite some time and should not be much of a surprise to markets. Further, as shown in [Figure 1], excluding the TCJA rate, this will still be the lowest tax rate in about 70 years and the effective tax rate has also declined. While the general direction of corporate tax rates has been lower for most of the last 70 years, how has the market been impacted when we have had tax increases? As shown in [Figure 2], markets historically have absorbed higher corporate tax rates, although with below-average returns. While we don’t think higher rates would be retroactive, they could take away some of the momentum from recent upside surprises in earnings growth we’ve seen so far in 2021 and contribute to a choppier market. Proposed tax provisions to raise funds for BBB on the household side include increasing the top tax rate on ordinary income from 37% to 39.6%, and raising the capital gains and dividends taxes on those who earn more than $1 million to a maximum of 43.4% from the current 23.8%—a stunning increase if fully instituted. At the same time, only 0.32% of the population makes more than $1 million a year, so the truth is this won’t impact the other 99.68% of the population. Looking at history, capital gains taxes did increase in 1986 and 2013, but the economy was on firm footing and the S&P 500 produced gains of more than 9% and 25%, respectively, over the following twelve months. On the other hand, the S&P 500 declined in the twelve months following capital gains increases in 1969 and 1976, which saw an economy marred by higher inflation and sluggish growth. Is it as simple as how the economy is doing? Policy matters, but broader economic trends matter more. If we see a capital gains tax increase, we do expect some investors may rotate out of equities and seek more tax-friendly opportunities, but that would have to be balanced against the decision to accelerate capital gains. Long-term investors may simply wait out the new rate on expectations that it may be changed again by a subsequent administration.
A Way Too Early Peak at 2022 Mid-Terms
Which brings us to the final point—the durability of any large policy change in an era of near political balance. President Biden is unwinding some policies of the Trump administration, and President Trump unwound policies of the Obama administration. Neither party has held the White House for more than eight years since Bush beat Dukakis. Congress has also been hotly contested with more frequent swings. Over the last 40 years, the House has changed hands seven times and the Senate four. If you don’t like the policy environment, wait a few years—we’ll get a new one. The American electorate is nearly evenly divided right now, fostering more frequent swings, and also a certain wisdom in rejecting the excesses of both parties. Looking to 2022, mid-terms in the House historically have a strong tendency to swing away from the party that holds the presidency. The president’s party has lost ground in the House in every mid-term since 1938 except two (1998 and 2002), with an average swing of just under 30 seats. An already evenly balanced House makes a large swing less likely, but with Democrats holding just an eight-seat advantage right now (with several vacancies) and some added hurdles for Democrats from redistricting, the Republicans are favorites to retake the House. The Senate is evenly divided right now, which makes a swing more plausible. However, only about a third of the Senate seats are up for grabs in any election and the 2022 map favors the Democrats, who only have to defend 14 seats while the Republicans have to defend 20. (Republicans have the advantage in 2024.) This math suggests that the Democrats are likely to hold the Senate. We’ve often commented that markets tend to like mixed government and we may have one ahead—if not in 2022, then very likely not much further down the road. While we don’t know the outcome of the election, what we do know is that policies will change, which means markets will be looking most closely at the near-term impact of policy changes, rather than their enduring legacy.
Conclusion
The massive fiscal and monetary policy support that helped the economy (and the stock market) get through the pandemic is starting to move toward the sidelines. Markets like stimulus, and even a gradual move to the sidelines may cause some bumps. But overall, we think that macroeconomic conditions, rather than policy, will be the most important driver of the return environment in the year ahead. We are watching negotiations over corporate taxes closely, but if history holds true, tax increases may slow markets, but they shouldn’t fundamentally shift the return outlook. U.S. businesses remain agile, and even with the potential hit from higher taxes, there will be plenty of opportunities ahead. Read previous editions of Weekly Market Commentary on lpl.com at News & Media. Barry Gilbert, PhD, CFA, Asset Allocation Strategist, LPL Financial
Ryan Detrick, CMT, Chief Market Strategist, LPL Financial
______________________________________________________________________________________________ IMPORTANT DISCLOSURES This material is for general information only and is not intended to provide specific advice or recommendations for any individual. There is no assurance that the views or strategies discussed are suitable for all investors or will yield positive outcomes. Investing involves risks including possible loss of principal. Any economic forecasts set forth may not develop as predicted and are subject to change. References to markets, asset classes, and sectors are generally regarding the corresponding market index. Indexes are unmanaged statistical composites and cannot be invested into directly. Index performance is not indicative of the performance of any investment and do not reflect fees, expenses, or sales charges. All performance referenced is historical and is no guarantee of future results. Any company names noted herein are for educational purposes only and not an indication of trading intent or a solicitation of their products or services. LPL Financial doesn’t provide research on individual equities. All information is believed to be from reliable sources; however, LPL Financial makes no representation as to its completeness or accuracy. U.S. Treasuries may be considered “safe haven” investments but do carry some degree of risk including interest rate, credit, and market risk. Bonds are subject to market and interest rate risk if sold prior to maturity. Bond values will decline as interest rates rise and bonds are subject to availability and change in price. The Standard & Poor’s 500 Index (S&P500) is a capitalization-weighted index of 500 stocks designed to measure performance of the broad domestic economy through changes in the aggregate market value of 500 stocks representing all major industries. The PE ratio (price-to-earnings ratio) is a measure of the price paid for a share relative to the annual net income or profit earned by the firm per share. It is a financial ratio used for valuation: a higher PE ratio means that investors are paying more for each unit of net income, so the stock is more expensive compared to one with lower PE ratio. Earnings per share (EPS) is the portion of a company’s profit allocated to each outstanding share of common stock. EPS serves as an indicator of a company’s profitability. Earnings per share is generally considered to be the single most important variable in determining a share’s price. It is also a major component used to calculate the price-to-earnings valuation ratio. All index data from FactSet. This research material has been prepared by LPL Financial LLC. Securities and advisory services offered through LPL Financial (LPL), a registered investment advisor and broker-dealer (member FINRA/SIPC). Insurance products are offered through LPL or its licensed affiliates. To the extent you are receiving investment advice from a separately registered independent investment advisor that is not an LPL affiliate, please note LPL makes no representation with respect to such entity. Not Insured by FDIC/NCUA or Any Other Government Agency | Not Bank/Credit Union Guaranteed | Not Bank/Credit Union Deposits or Obligations | May Lose Value
RES-777150-0621 | For Public Use | Tracking # 1-05151833 (Exp. 06/22)
After one of the best starts to a bull market in history, the rally has started to show signs of fatigue. A strong economic recovery lies ahead as the roepening continues, bolstering a very strong earnings outlook that is helping stocks grow into elevated valuations. However, in the second half of the year, as inflationary pressures build, interest rates potentially rise further, and this bull market gets a little older, the pace of stock market gains will likely slow and come with more volatility.
History Doesn't Repeat But It Often Rhymes
After a nearly 90% rally off the March 2020 lows, it’s not much of a surprise that since mid-April the S&P 500 Index has been choppy and generally moved sideways. Consider that the 1982 and 2009 bull markets both suffered from some fatigue several months into their second years, providing a useful historical analogue. With the U.S. economy picking up speed as the end of the pandemic likely approaches, the economic cycle is maturing. The pickup in inflation and related concerns about the Federal Reserve (Fed) pulling back support offer evidence of an economic cycle getting a bit older. Older cycles tend to bring more moderate stock market gains. Although no one would argue that this cycle looks like any other we have experienced in modern history, studying the second year of historical bull markets—as we also did in our Outlook 2021—can be instructive. Looking back at all of the bull markets since 1950, the average S&P 500 gain during the second year has been about 13% [Figure 1]. With stocks already up about 7% since March 23, 2021, following this pattern would allow for about 6% upside over the next 10 months. However, when focusing on bull markets that followed 30% or greater declines, as the current one did, the average gain during the second year has actually been 17%. Achieving that return would put the index above the high end of our year-end S&P 500 target range of 4,400 to 4,450. We can also look at pullbacks (5-10% decline) and corrections (10-20% decline) during the second years of historical bull markets for a guide to the type of volatility the stock market might experience over the next six to nine months. As shown in [Figure 1], the average maximum drawdown for the index during those years has been about 10%. In the second year of the 2009 bull market, the index corrected about 17%. Given the fast pace of the reopening and the amount of stimulus spending still working its way through the economy, we would expect drawdowns to be average, if not less, as the bull market moves closer to its third birthday on March 23, 2022. Inflation that proves more intense and longer lasting than the Fed expects, which could drive interest rates sharply higher, ranks at the top of potential causes of a correction in the second half of 2021 or early in 2022.
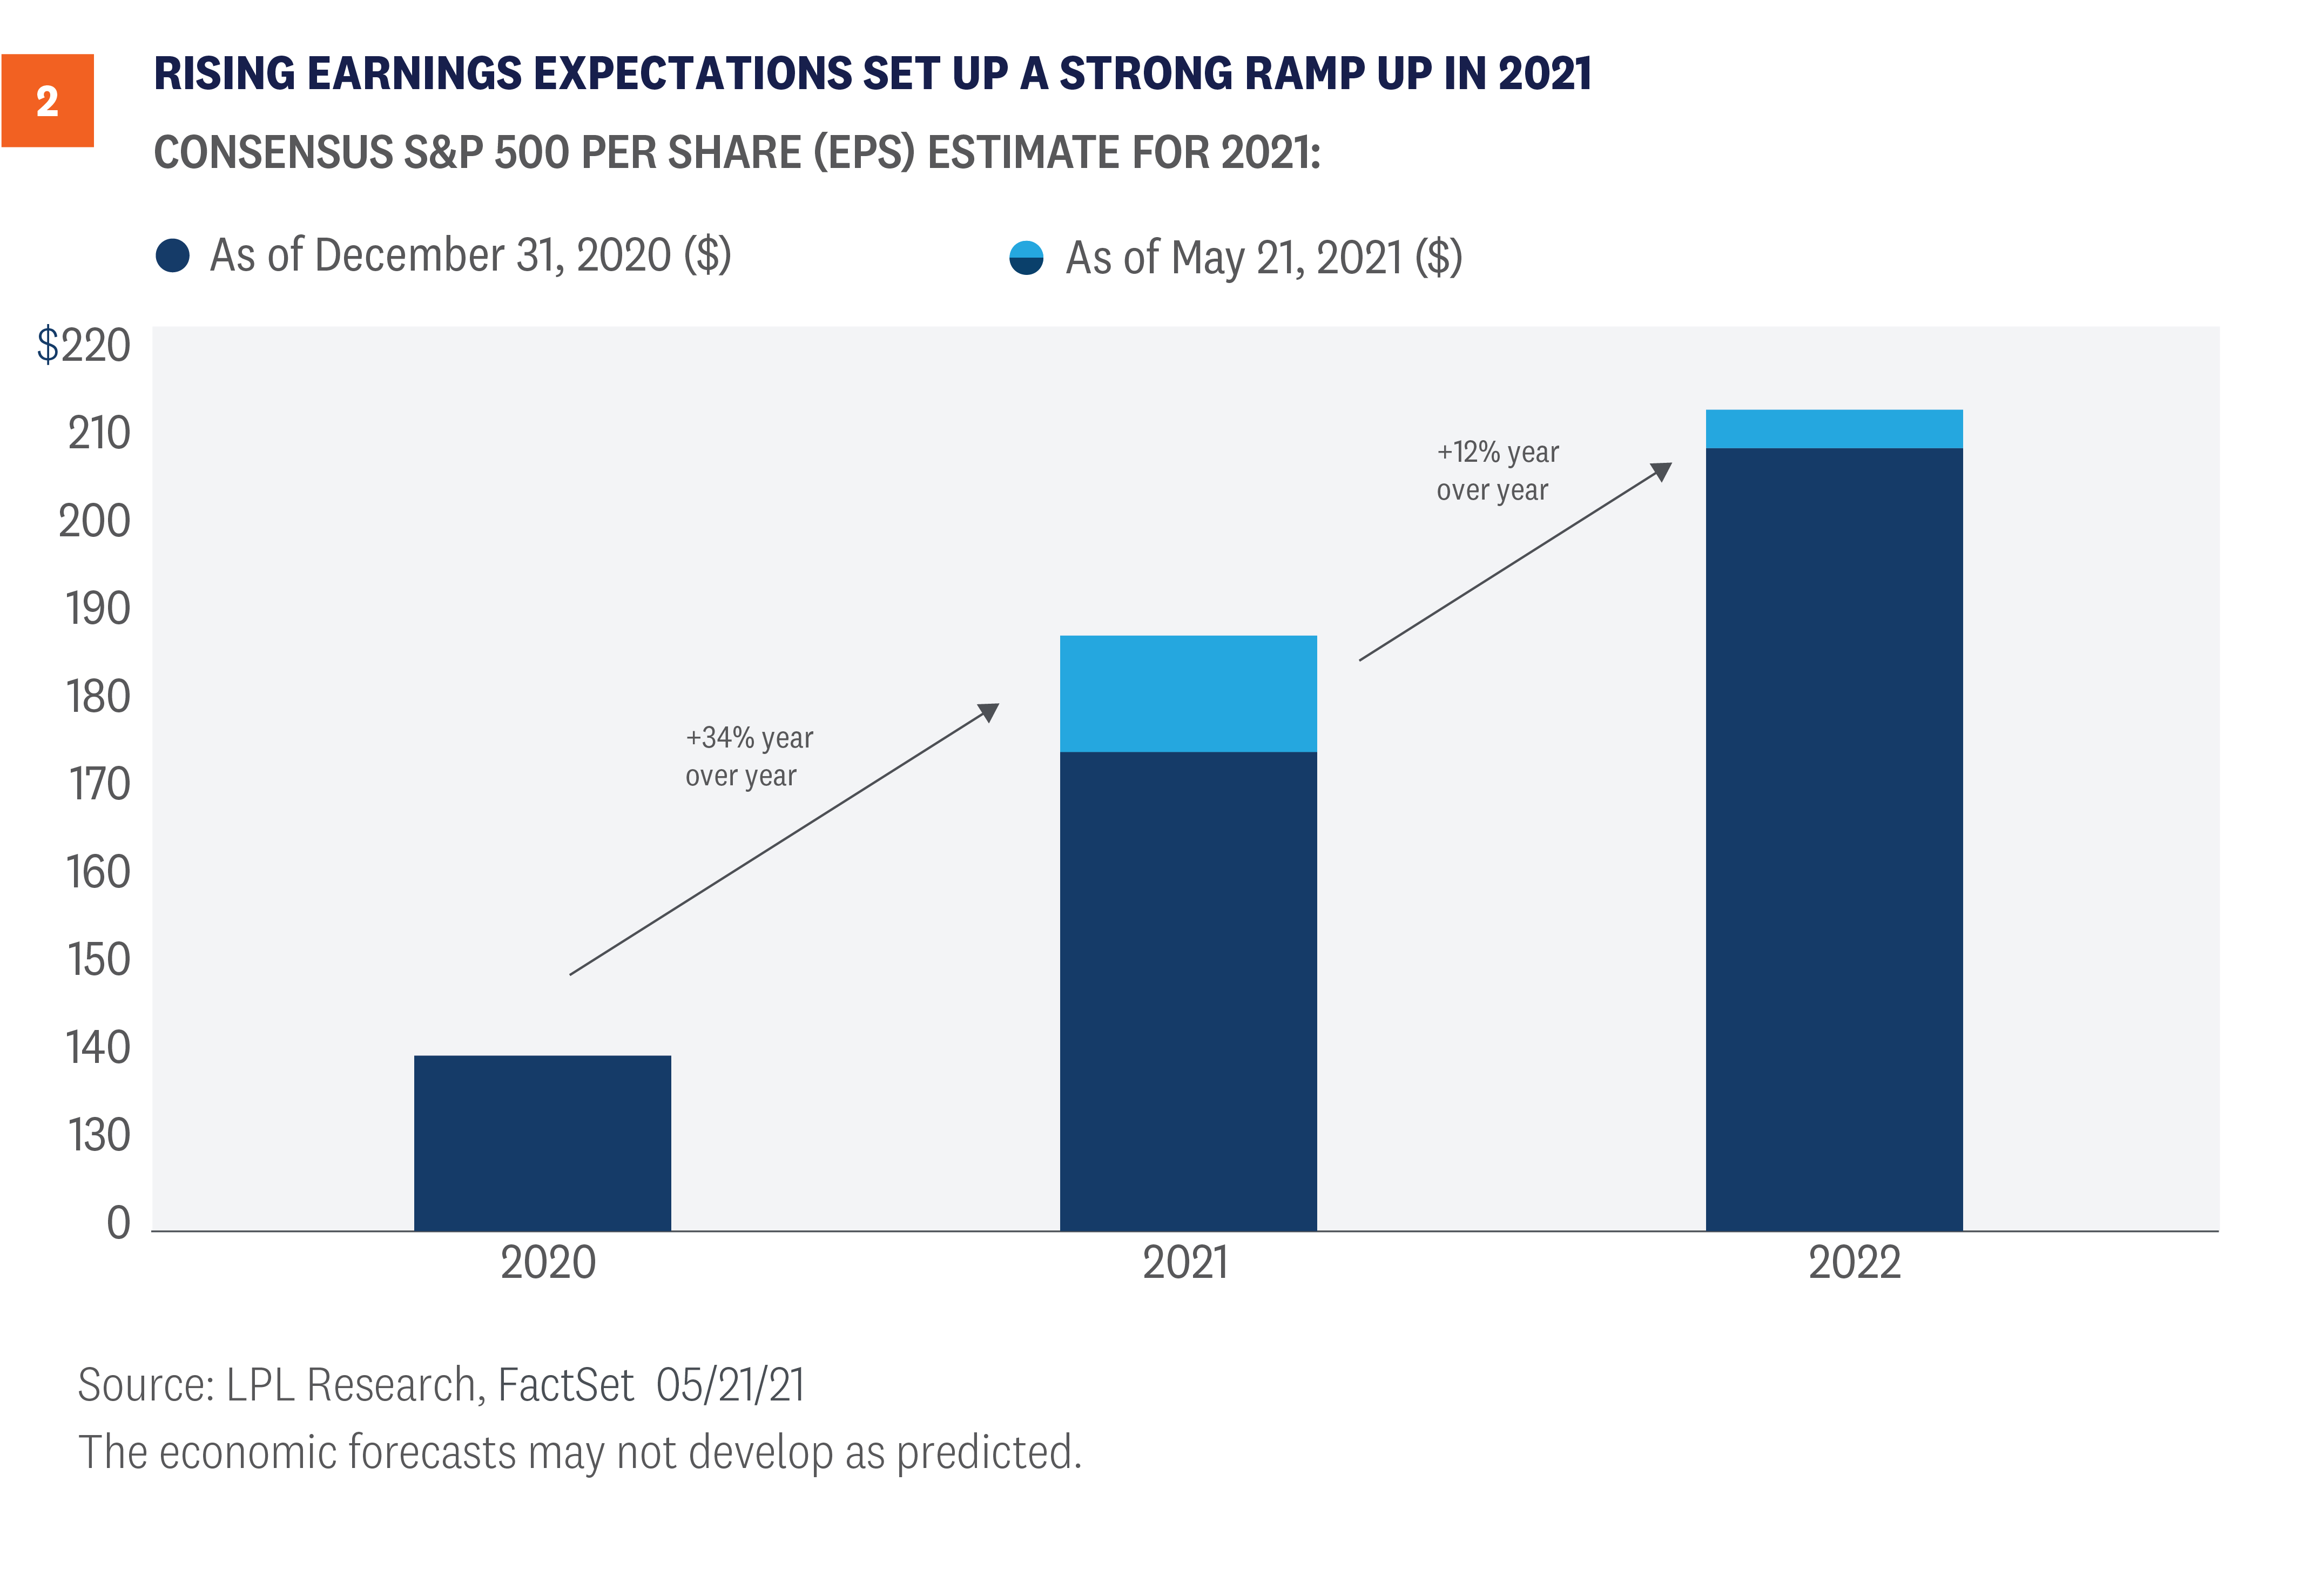
Earnings Outlook Strengthens
Coming off of a stunning first-quarter earnings season that saw results well ahead of the best-case scenario for nearly all strategists, corporate America is firing on all cylinders. As shown in [Figure 2], not only are earnings expected to ramp up significantly over the remainder of 2021 as the economic rebound continues, but estimates have risen significantly since the start of the year. Reflecting the tremendous strength in corporate profits, our forecast for S&P 500 earnings per share (EPS) in 2021 is $187.50-$190, a 34% increase from 2020, and up from our prior $165 estimate at the start of the year. We believe our estimated range, which is in line with the current consensus estimate, is reasonable given the strong economic growth outlook and massive amount of fiscal stimulus still working its way through the economy. Given the trajectory of economic growth and tremendous momentum exhibited by corporate America during the first quarter, it’s not hard to envision even higher numbers. A significant pickup in inflation could present risk to corporate profit margins. If the labor market tightens in a fully reopened economy, companies may see upward pressure on wages. Supply shortages, higher commodity prices, and rising borrowing costs may also erode profitability of U.S. companies. U.S. businesses are also closely monitoring policy developments, as a potential increase in the corporate tax rate would have an immediate impact on their bottom lines. Meanwhile, some international economies are still struggling to get through the pandemic, which could present a headwind for U.S.-based multinationals.
Low Interest Rates Supporting Valuations
Strong earnings growth is helping stocks grow into elevated valuations. However, based on the most commonly used valuation metrics such as the price-to-earnings ratio (P/E), stock market valuations are still elevated. The S&P 500 Index is trading at a forward P/E of 21 times the consensus earnings estimate for the next 12 months, several points above the post-1980 average of 17 (source: FactSet). By that measure, a lot of good news is priced in. But we would not evaluate stock valuations in a vacuum. Fundamentally, stock valuations represent the present value of future earnings. When we calculate today’s value of future profits, interest rates come into play. When incorporating interest rates into valuation analysis, we find stocks are actually quite reasonably priced. Based on 2021 forecasts relative to their prices, S&P 500 earnings are about three percentage points cheaper than the 10-year Treasury “earnings,” which is their yield. The long-term average of this “equity risk premium” is about 0.8%, indicating stocks are cheaper than bonds, as we discussed in our April 26, 2021 Weekly Market Commentary. If inflation risk remains manageable throughout the second half of the year and yields rise only gradually, we would anticipate that earnings growth would continue to support market gains.
Conclusion
We expect additional gains for stocks in the second half of the year, but they are likely to be more modest than the gains we’ve seen so far, and those additional gains are likely to come with more volatility. Amid a backdrop of an improving economy, massive levels of fiscal and monetary stimulus, and rising vaccination rates, we would not expect pullbacks to last very long and any potential corrections are likely to be shallow. We would be looking for opportunities to add equities on potential dips. We reiterate our 2021 year-end S&P 500 fair-value target range of 4,400-4,450, roughly 6% above March 21, 2021, levels at the midpoint of the range. Inflation, possible interest-rate spikes, higher taxes, COVID-19 spread outside the U.S., and geopolitics are among the primary risks to our forecast. Read previous editions of Weekly Market Commentary on lpl.com at News & Media. Jeff Buchbinder, CFA, Equity Strategist, LPL Financial
Ryan Detrick, CMT, Chief Market Strategist, LPL Financial
______________________________________________________________________________________________ IMPORTANT DISCLOSURES This material is for general information only and is not intended to provide specific advice or recommendations for any individual. There is no assurance that the views or strategies discussed are suitable for all investors or will yield positive outcomes. Investing involves risks including possible loss of principal. Any economic forecasts set forth may not develop as predicted and are subject to change. References to markets, asset classes, and sectors are generally regarding the corresponding market index. Indexes are unmanaged statistical composites and cannot be invested into directly. Index performance is not indicative of the performance of any investment and do not reflect fees, expenses, or sales charges. All performance referenced is historical and is no guarantee of future results. Any company names noted herein are for educational purposes only and not an indication of trading intent or a solicitation of their products or services. LPL Financial doesn’t provide research on individual equities. All information is believed to be from reliable sources; however, LPL Financial makes no representation as to its completeness or accuracy. US Treasuries may be considered “safe haven” investments but do carry some degree of risk including interest rate, credit, and market risk. Bonds are subject to market and interest rate risk if sold prior to maturity. Bond values will decline as interest rates rise and bonds are subject to availability and change in price. The Standard & Poor’s 500 Index (S&P500) is a capitalization-weighted index of 500 stocks designed to measure performance of the broad domestic economy through changes in the aggregate market value of 500 stocks representing all major industries. The PE ratio (price-to-earnings ratio) is a measure of the price paid for a share relative to the annual net income or profit earned by the firm per share. It is a financial ratio used for valuation: a higher PE ratio means that investors are paying more for each unit of net income, so the stock is more expensive compared to one with lower PE ratio. Earnings per share (EPS) is the portion of a company’s profit allocated to each outstanding share of common stock. EPS serves as an indicator of a company’s profitability. Earnings per share is generally considered to be the single most important variable in determining a share’s price. It is also a major component used to calculate the price-to-earnings valuation ratio. All index data from FactSet. Please read the full Outlook 2021: Powering Forward publication for additional description and disclosure. This research material has been prepared by LPL Financial LLC. Securities and advisory services offered through LPL Financial (LPL), a registered investment advisor and broker-dealer (member FINRA/SIPC). Insurance products are offered through LPL or its licensed affiliates. To the extent you are receiving investment advice from a separately registered independent investment advisor that is not an LPL affiliate, please note LPL makes no representation with respect to such entity. Not Insured by FDIC/NCUA or Any Other Government Agency | Not Bank/Credit Union Guaranteed | Not Bank/Credit Union Deposits or Obligations | May Lose Value
RES-761100-0521 | For Public Use | Tracking # 1-05147072 (Exp. 05/22)
Progress against the virus combined with historic stimulus measures have helped the U.S. economy storm back from pandemic lockdown-driven lows.
Source: WEEKLY COMMENTARY
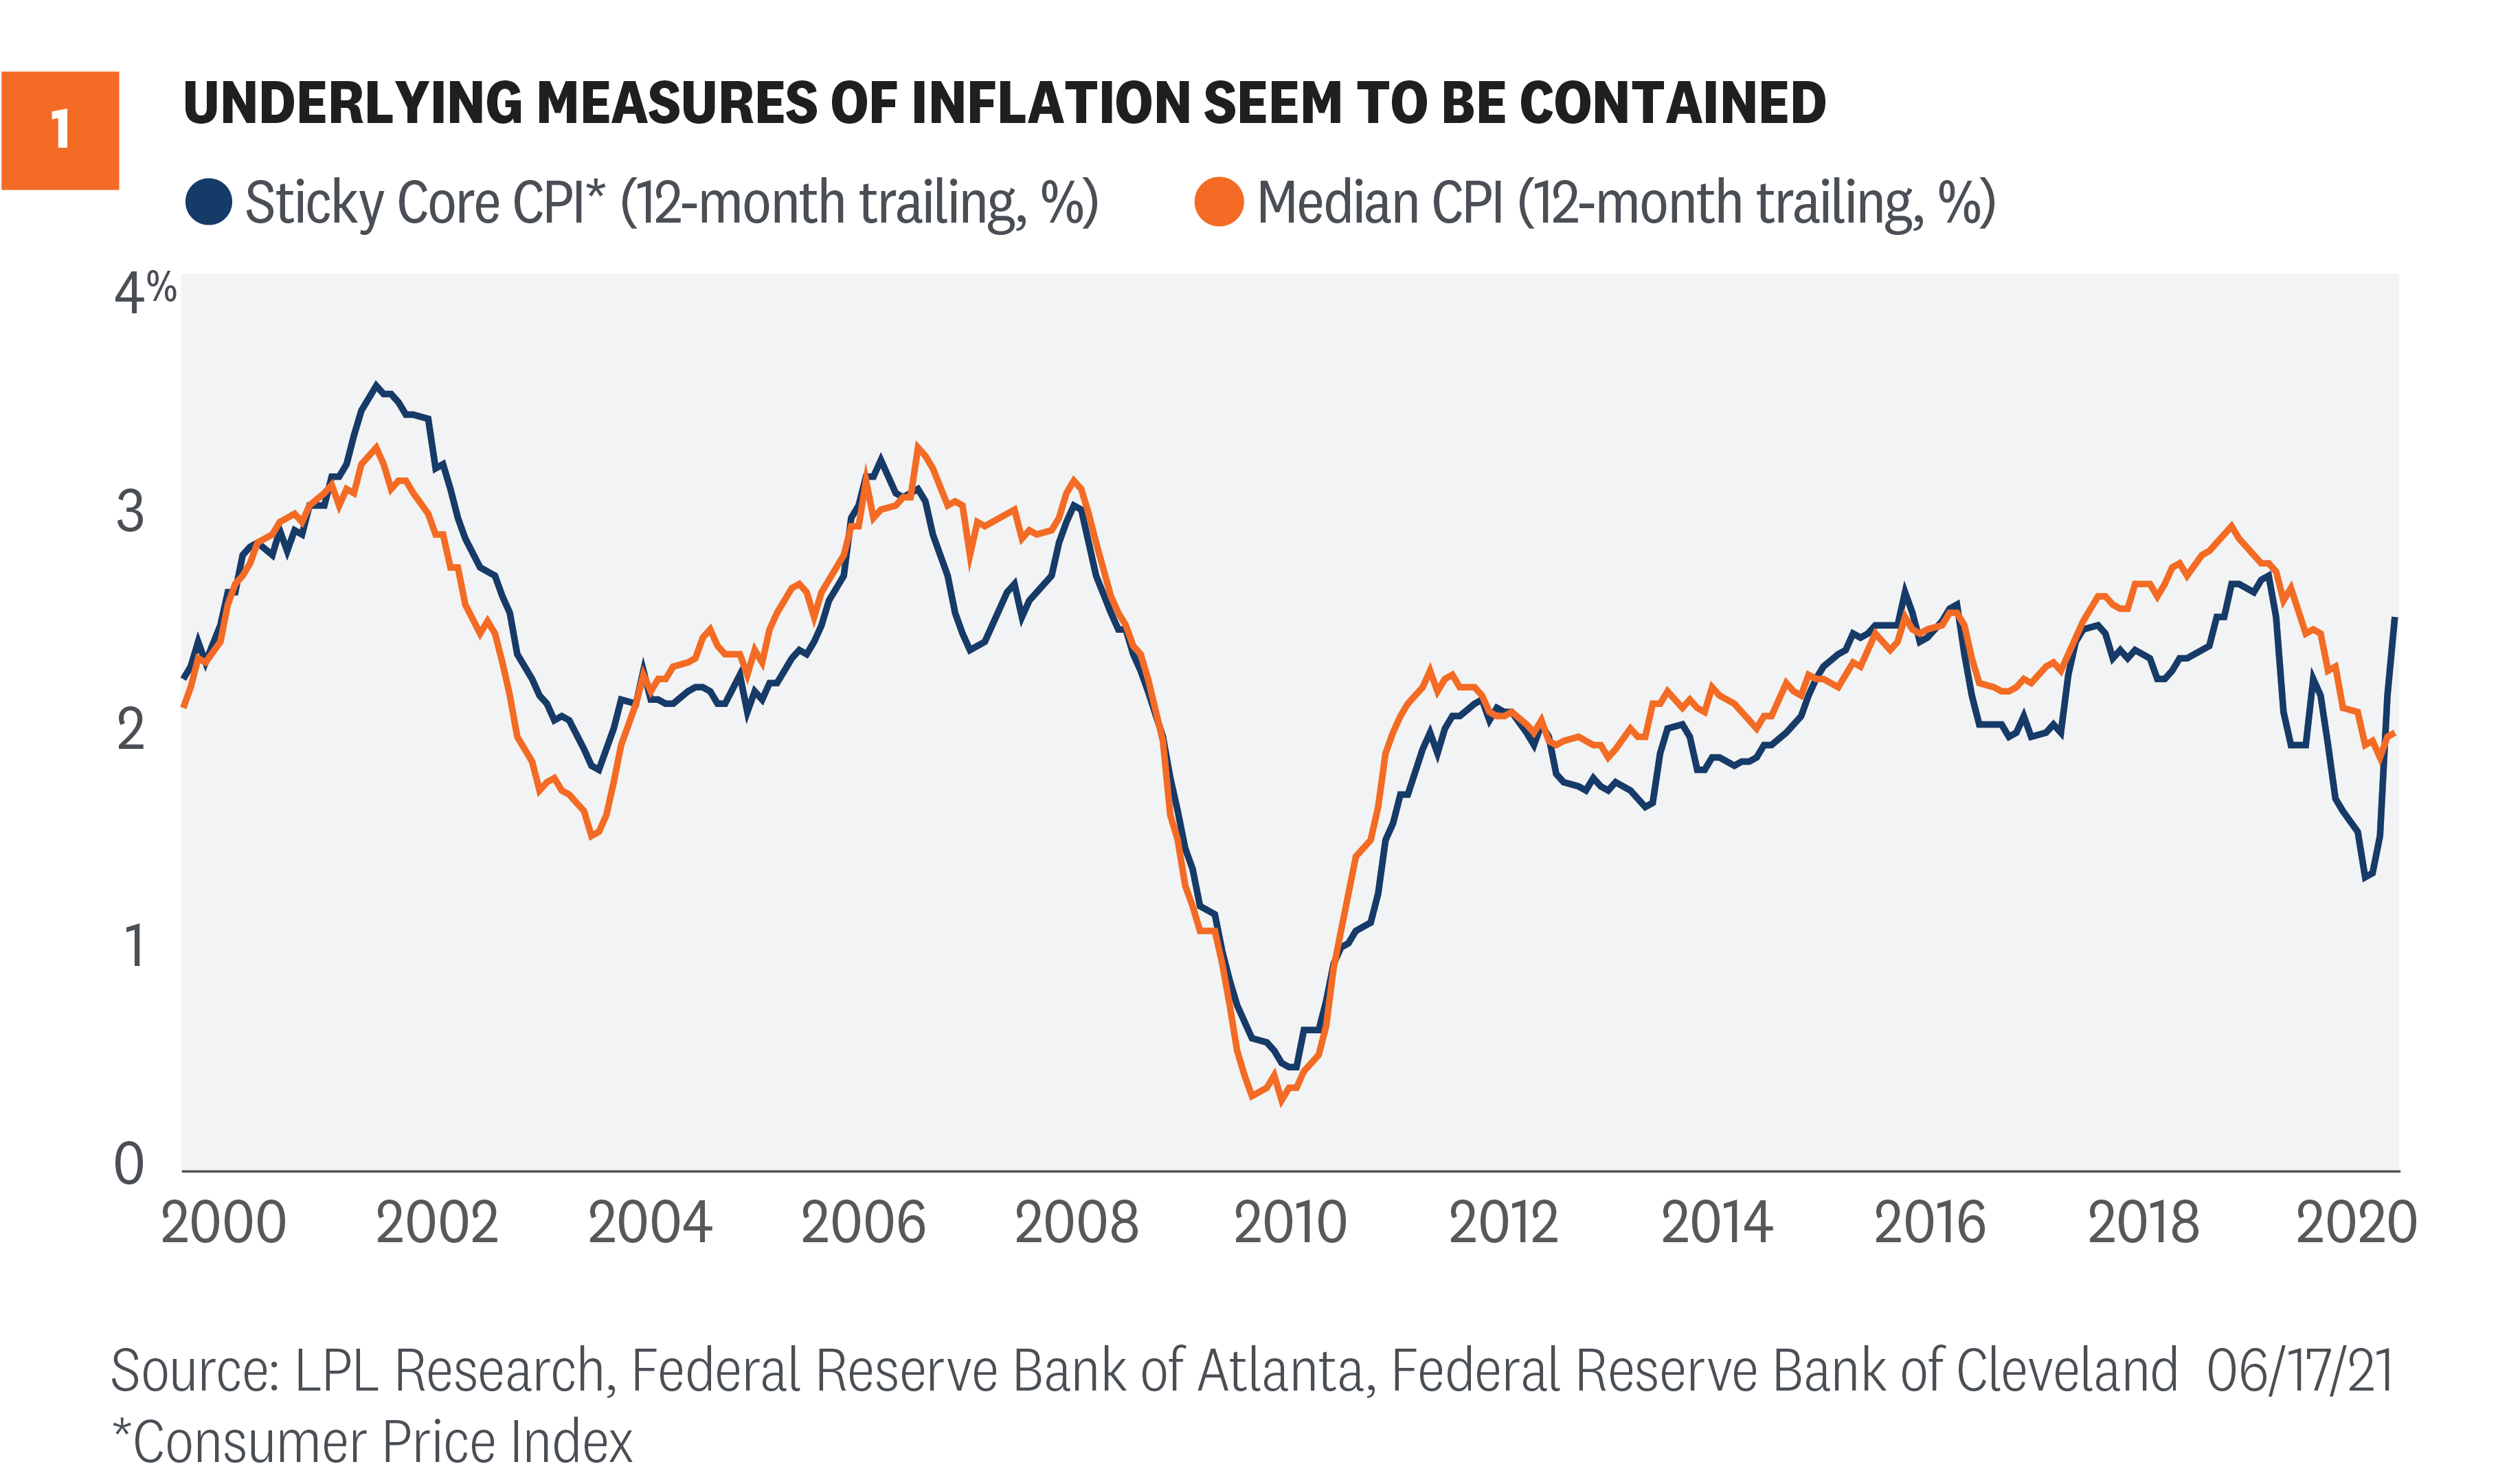
Inflation has been on the rise. Investors are not as interested in what’s happening now as they are in what’s happening next. Meanwhile, the Federal Reserve (Fed) shared its views at the conclusion of its last policy meeting on Wednesday, June 16. And while the Fed’s position that inflation is likely to be transitory has become stronger, not weaker, Fed members have seemingly different opinions on the future path of monetary support. Inflation has been on the rise. Everyone knows it and feels the impact with every purchase. The Consumer Price Index (CPI) spiked to 5.0% year over year in May, the most since 2008, while core CPI (excluding food energy) hit 3.8%, the highest since 1992. Inflation has been rising and the Fed is watching. How will markets react to any potential inflation over the next year? We do know this: Markets will be looking forward, not backward. By the time something becomes a “thing,” a meme, or makes a magazine cover, market participants are often past it, as we discussed in our June 16 blog, Why Inflation Worries Likely Just Peaked. Markets are no longer watching to see if inflation will spike. It already has. In fact, since the big upside surprise in the April inflation data, released May 12, many inflation-sensitive assets have been underperforming. Copper? Down. Lumber? Down. The 10-year Treasury yield? Down. Market-implied inflation rates? Down. Gold? Down. At the conclusion of its last policy meeting on June 16, the Fed shared its view on what may be coming for inflation. In its updated forecasts, the Fed acknowledged it had missed on inflation expectations, upgrading its preferred core inflation forecast for 2021 from 2.2% all the way up to 3.0%. That’s a large jump, but that’s based on what’s behind us. The forecast for the same index in 2022 and 2023 scarcely moved, at 2.1% for both years. Inflation is certainly still capable of coming in hotter than expected. The difference between now and earlier this year is that inflation expectations are already elevated. In order to see inflation assets really perk back up, we would probably need to see stronger signs that higher inflation may be persistent. To get a read on that, it may be better to look at prices that tend to be more stable. We know there are areas where we’re seeing extreme price moves, which is impacting broader measures of inflation. But what about prices that tend not to move? There is such a measure, developed by the Federal Reserve Bank of Atlanta, called sticky core inflation. As seen in [Figure 1], unlike CPI and even core CPI, sticky core prices are not setting multi-decade or multi-year highs. Sticky core CPI is up 2.6% year over year. The last time it was that high was…2020. There are still some warning signs though. While you have to be careful annualizing monthly data because it multiplies small, potentially meaningless, moves, annualized sticky CPI in each of the last two months was over 4% and that hasn’t happened since 1992. But even sticky core CPI has had some price idiosyncrasies in the current environment. If you take just the median move of the CPI components, the middle change for any given month, 12-month price changes have actually been declining. And the last two months? Somewhat elevated but nothing special.
We’ll be watching both sticky core CPI and median CPI to help monitor the likelihood that inflation will become persistent. We do think inflation will be elevated over the rest of 2021—and possibly into 2022—before it really starts settling down, but that’s still consistent with inflation being transitory. And it may remain somewhat higher after that compared to the last cycle as deglobalization and a potentially weaker dollar offset some of the structural forces that we think will continue to weigh on inflation. If inflation does start to look more persistent, it will certainly be felt on Main Street. For Wall Street, the immediate fear wouldn’t be the inflation itself, but rather its ability to force the Fed’s hand and accelerate policy tightening. But, based on how markets have been responding recently, the Fed’s position that inflation is likely to be transitory has become stronger, not weaker.
Speaking Of The Fed
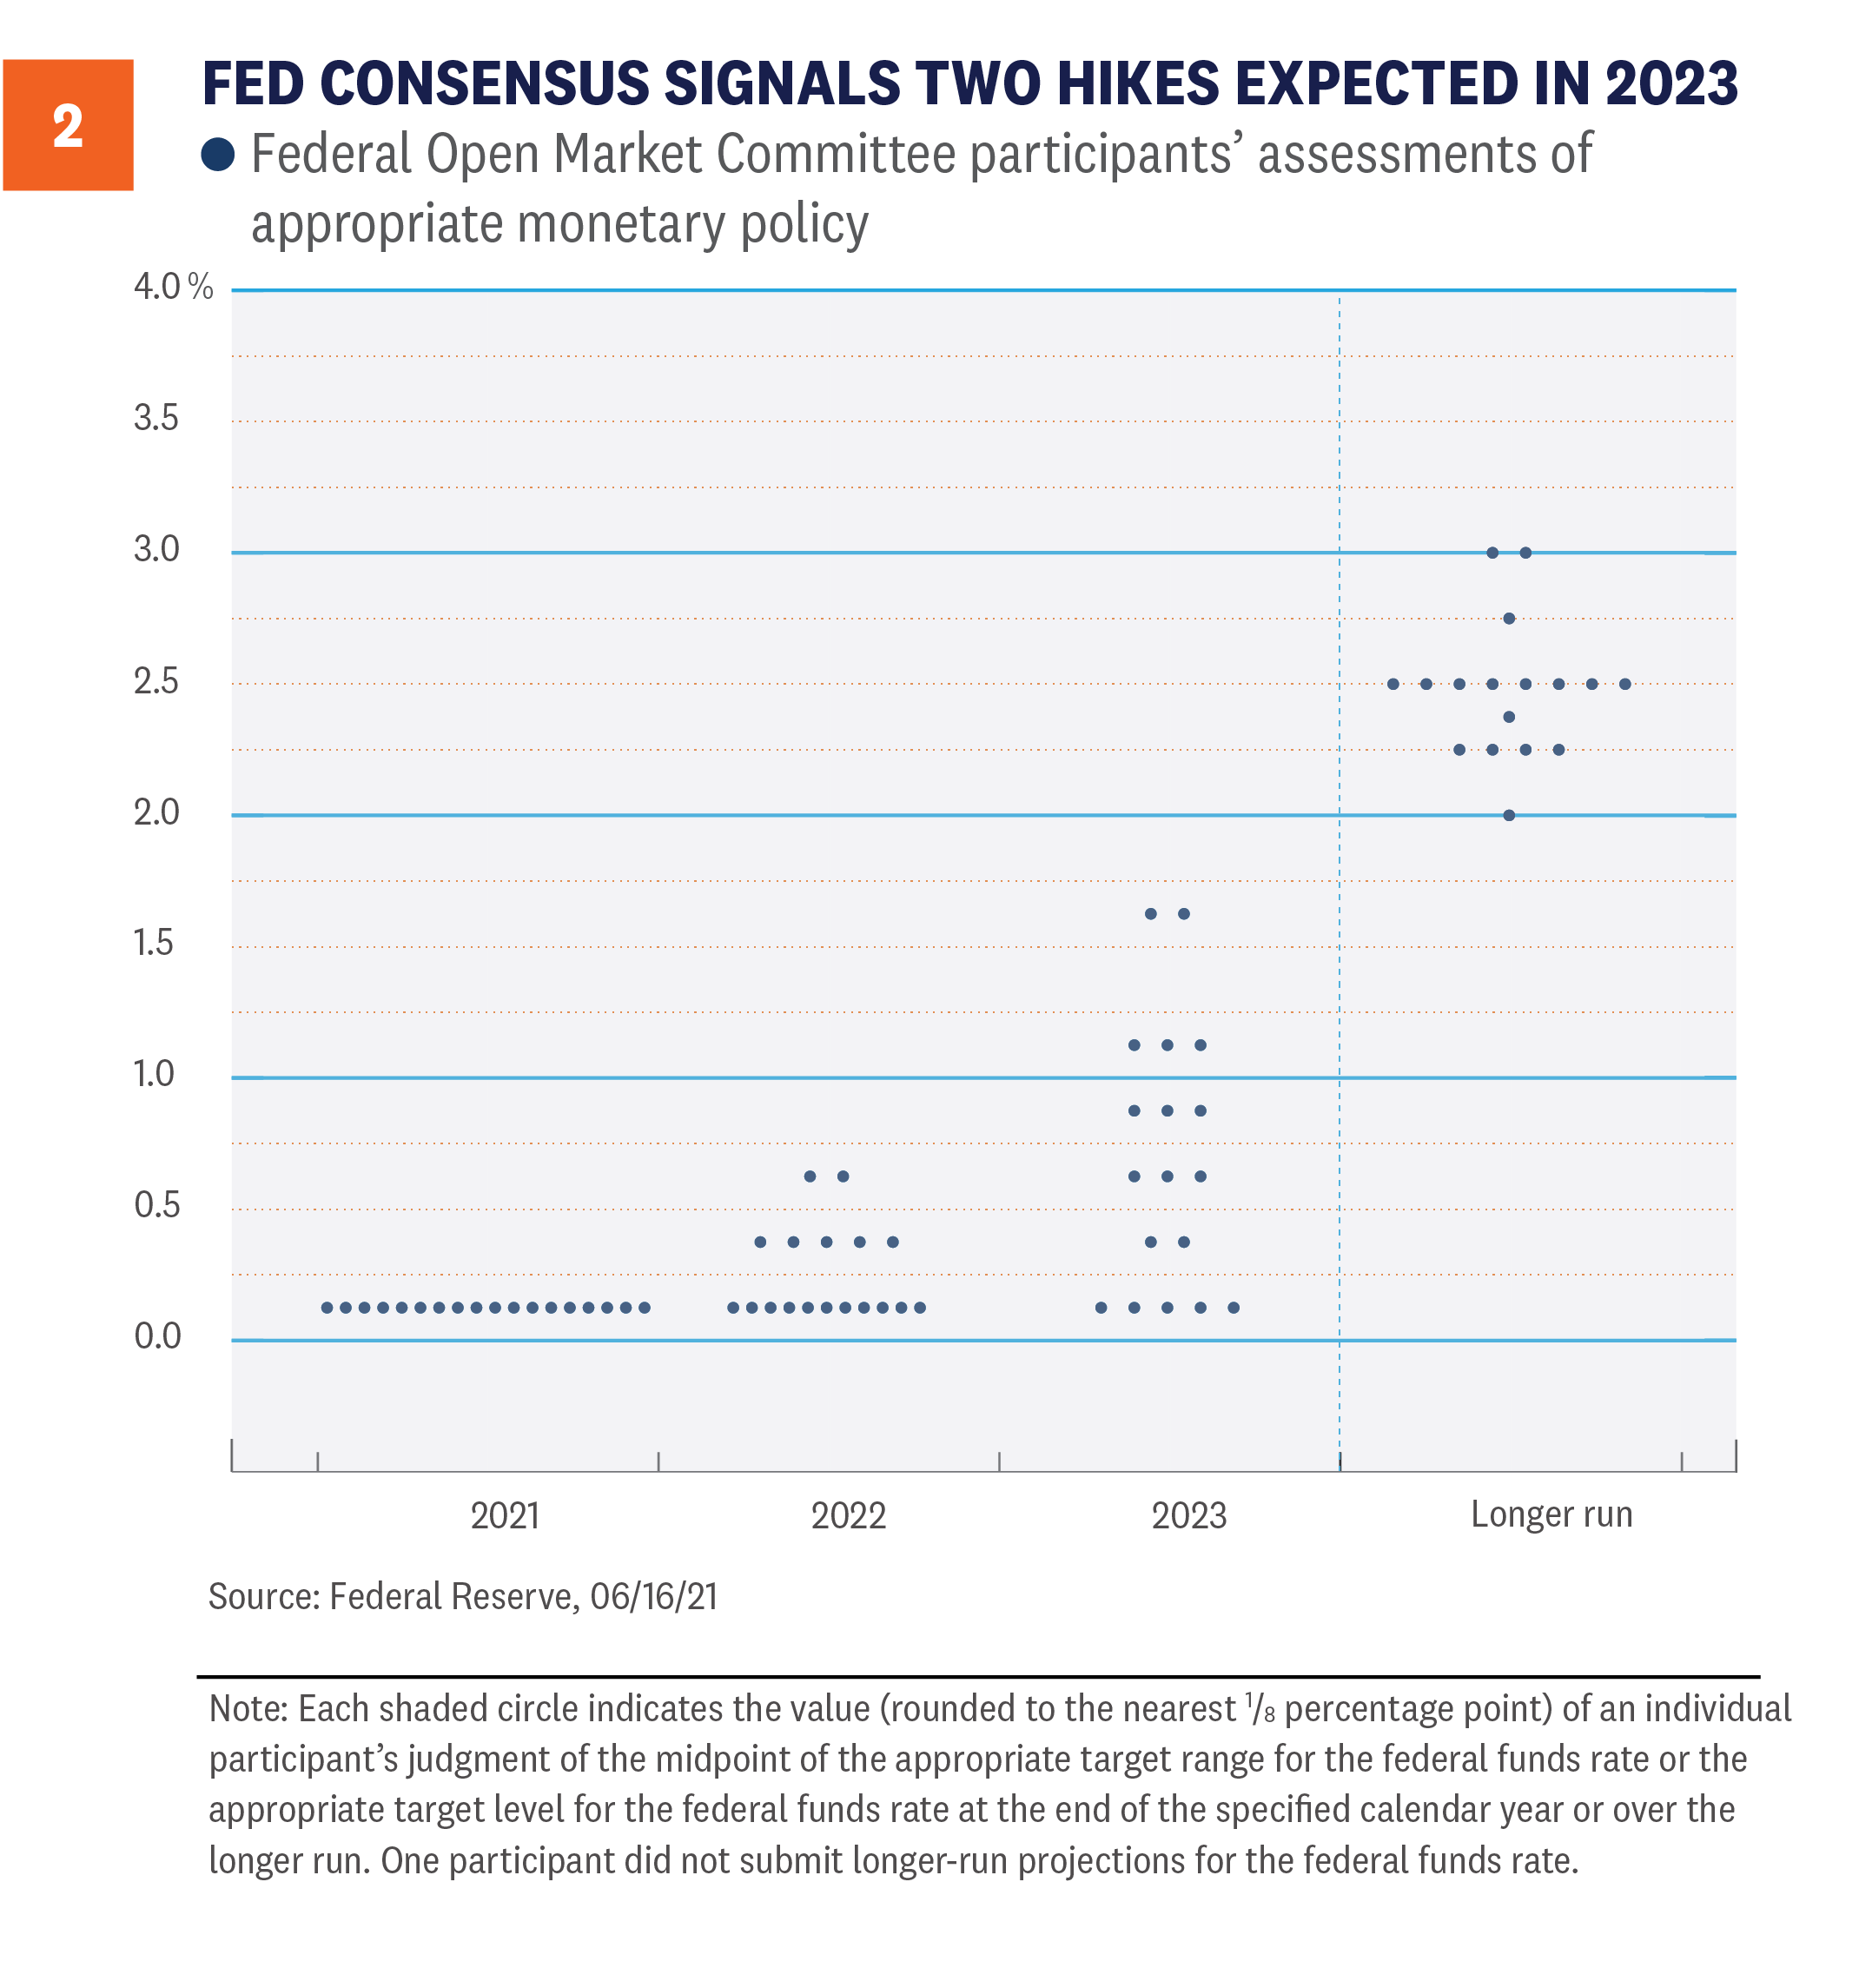
The Fed ended its two-day Federal Open Market Committee (FOMC) meeting last week and, as expected, there were no changes to its current interest-rate or bond-purchasing policies. However, signaling on the future path of short-term interest rates seemingly surprised markets because the number of Fed members who now expect interest-rate hikes in 2023 changed dramatically, relative to the last FOMC release. While an initial rate hike was once thought of as a 2024 event at the earliest, as seen in chart below, the majority of members now expect at least two quarter-point interest-rate hikes to take place in 2023. Additionally, seven members (out of 18) expect at least one rate hike in 2022. These “dot-plot” projections are not voted on—nor do they represent official policy [Figure 2]. But they do show the divergent opinions by some of the committee members. In fact, the market may have interpreted the changing projections as a shift in the way some committee members are interpreting the Fed’s new Average Inflation Target (AIT) mandate. That some members think interest rates should move higher next year is a notable difference from what some Fed members have repeatedly said: that they want inflation to run above 2% for some time before they raise interest rates.
What Do Hawks and Doves Have to do With Monetary Policy?
While Jerome Powell is the chairman of the FOMC and likely the most recognizable member, there are 18 other members within the committee (and also one vacant position). Anyone who has been part of a big group setting knows that getting everyone in total agreement is nearly a Sisyphean task. Since 2014, though, there has not been a single dissenting, recorded vote cast by any voting member. However, some recent public comments and the recently released dot-plot may show that not everyone is in total agreement with the direction of current monetary policy. For example, Dallas Fed President, Robert Kaplan, often thought of as one of the most hawkish members of the committee, has repeatedly stated that the Fed should start to reduce or even eliminate its purchases of mortgage securities “sooner rather than later.” Others on the committee, including Powell, continue to defend the mortgage purchases. While Kaplan is not a voting member, he does provide input into policy decisions. What does it mean to be “hawkish” or “dovish”? Hawkish Fed members are generally concerned about inflation first, and want to start to tighten monetary policy through interest-rate increases and/or the tapering of bond purchases. Doves are those members who want to continue to provide accommodative monetary policy to support the economic recovery. Of the 19 current members, seven can be classified as dovish, eight as neutral, and four as reliably hawkish. Not all 19 current members are voting members. There are currently 11 voting members (there is one vacant voting position) and of those 11, five members are reliably dovish—including Chairman Powell and Vice Chair Richard Clarida—and six members are rated as neutral. So, given the tendencies of the group broadly, the likely cause of the negative initial reaction in the bond market last week is that so many participants now think raising interest rates should occur in 2023. That the overall committee may have become more hawkish is notable. The concern now is that the Fed may speed up the removal of accommodative monetary policy and react sooner than markets are anticipating.
Conclusion
Inflation has certainly been the word of the year. Consumers and investors have seen and felt the impact of inflation. But the structural headwinds that have kept inflationary pressures at bay for decades are still in place. We do think inflation will be elevated over the rest of 2021 and possibly into 2022 before it really starts settling down, but that’s still consistent with inflation being transitory. How the Fed reacts to the data will be interesting, though. We continue to watch closely the risk associated with the Fed acting out of concert with what markets are expecting. Over the next few weeks we’re likely to hear from a number of Fed officials, so we’ll get more clarity on how thinking has changed recently. As such, it will be important to see who on the committee has become more hawkish. If it’s actual voting members, then markets may start to get more concerned. Read previous editions of Weekly Market Commentary on lpl.com at News & Media. Barry Gilbert, PhD, CFA, Asset Allocation Strategist, LPL Financial
Lawrence Gillum, CFA, Fixed Income Strategist, LPL Financial ______________________________________________________________________________________________ IMPORTANT DISCLOSURES This material is for general information only and is not intended to provide specific advice or recommendations for any individual. There is no assurance that the views or strategies discussed are suitable for all investors or will yield positive outcomes. Investing involves risks including possible loss of principal. Any economic forecasts set forth may not develop as predicted and are subject to change. References to markets, asset classes, and sectors are generally regarding the corresponding market index. Indexes are unmanaged statistical composites and cannot be invested into directly. Index performance is not indicative of the performance of any investment and do not reflect fees, expenses, or sales charges. All performance referenced is historical and is no guarantee of future results. Any company names noted herein are for educational purposes only and not an indication of trading intent or a solicitation of their products or services. LPL Financial doesn’t provide research on individual equities. All information is believed to be from reliable sources; however, LPL Financial makes no representation as to its completeness or accuracy. US Treasuries may be considered “safe haven” investments but do carry some degree of risk including interest rate, credit, and market risk. Bonds are subject to market and interest rate risk if sold prior to maturity. Bond values will decline as interest rates rise and bonds are subject to availability and change in price. The Standard & Poor’s 500 Index (S&P500) is a capitalization-weighted index of 500 stocks designed to measure performance of the broad domestic economy through changes in the aggregate market value of 500 stocks representing all major industries. The PE ratio (price-to-earnings ratio) is a measure of the price paid for a share relative to the annual net income or profit earned by the firm per share. It is a financial ratio used for valuation: a higher PE ratio means that investors are paying more for each unit of net income, so the stock is more expensive compared to one with lower PE ratio. Earnings per share (EPS) is the portion of a company’s profit allocated to each outstanding share of common stock. EPS serves as an indicator of a company’s profitability. Earnings per share is generally considered to be the single most important variable in determining a share’s price. It is also a major component used to calculate the price-to-earnings valuation ratio. All index data from FactSet. This research material has been prepared by LPL Financial LLC. Securities and advisory services offered through LPL Financial (LPL), a registered investment advisor and broker-dealer (member FINRA/SIPC). Insurance products are offered through LPL or its licensed affiliates. To the extent you are receiving investment advice from a separately registered independent investment advisor that is not an LPL affiliate, please note LPL makes no representation with respect to such entity. Not Insured by FDIC/NCUA or Any Other Government Agency | Not Bank/Credit Union Guaranteed | Not Bank/Credit Union Deposits or Obligations | May Lose Value
RES-792651-0621 | For Public Use | Tracking # 1-05157762 (Exp. 06/22)
The next several months may historically be the most volatile of the year, but the U.S. economy continues to recover remarkably quickly with many positives.
Source: WEEKLY COMMENTARY
The economic recovery continues, as the recipe of vaccines, the reopening, and record stimulus all have combined to produce what should be one of the best years for growth ever. Although some economic indicators could be peaking or about to peak, the stage is set for this cycle of growth to continue for many years, which may surprise some investors. We discuss why inflation might be in the headlines, but still shouldn’t be a major worry for investors.
This Economic Cycle is Quite Young
The U.S. economic recovery is now in full swing. Despite the natural challenges of ramping back up, the recovery still seems capable of providing upside surprises. As a result of strides toward full reopening, rapid vaccine distribution, massive stimulus efforts, and support from the Fed, we recently upgraded our 2021 forecast for U.S. gross domestic product (GDP) growth to 6.25%-6.75%. Toss in a record number of earnings beats, resulting in S&P 500 Index first-quarter earnings growth of nearly 50% (FactSet), which is more than double the expectations at the start of the quarter, and it is clear the economy is humming right along. Last year’s 3.5% drop in GDP, the worst year since the Great Depression, is a thing of the past. Technically, the U.S. may still be in a recession, as the National Bureau of Economic Research (NBER) hasn’t called the end yet. But considering we’ve seen various levels of output match or exceed pre-pandemic levels, it’s clear we aren’t in a recession anymore, as it likely ended last summer. Retail sales, for instance, were making new highs by June 2020 and have soared higher over the past year. NBER isn’t about being first, they are about being right, and it isn’t abnormal for them to call the end of a recession a year or more after it officially ended. We’ve found that ISM manufacturing and services data tend to peak about a year after a recession ends, and both appear to have peaked in the spring—another clue the recession ended sometime last summer. Just because economic data is peaking doesn’t mean the new expansion is over. In fact, it’s perfectly normal to see the year-over-year levels of growth peak about a year after a recession ends, and be followed by many more years of growth. As shown in [Figure 1], the average expansion has lasted more than five years, with the last four cycles all lasting longer. The last expansion was the longest ever, making it to 11 years old before COVID-19 struck, and otherwise might have gone on even longer. However, this cycle may not last as long as the last one, as this wasn’t your average recession. Because the recession last year was likely the shortest ever (besting the six-month recession in the early 1980s) and the economy was supported by historic stimulus, some imbalances weren’t worked off like we tend to see in a normal recession. Corporate debt levels remain high, supported by low interest rates, and stock valuations never really reset. The good news is this new cycle of growth has enough going for it to be at least average, and even that would mean it still has another four years of economic growth left. There’s nothing wrong with being average!
Let's Talk About Inflation
The U.S. Bureau of Labor Statistics released its monthly report on inflation on Wednesday, May 12, revealing that the headline Consumer Price Index (CPI) rose 0.8% month over month and 4.2% year over year, well above expectations. Core CPI, which strips out volatile food and energy, rose 0.9% month over month, its highest reading since the early 1980s, and 3.0% year over year, again well above what economists thought. As a result, stocks had one of their worst days in months over fears higher inflation could mean the Fed will be forced to hike rates sooner. The market took notice, pushing the market-implied five-year breakeven inflation rate—the difference between five-year Treasury and five-year TIPS yields—up to a 13-year high. When there is a wide spread, market participants are expecting higher inflation. Meanwhile, various industrial metals, which are linked to higher inflation, are trading at 52-week—or even all-time highs. Copper, for instance, made a new all-time high last week and is also signaling higher inflation ahead. Here are some reasons we expect inflation to be transitory:
The root cause. The reopening is happening, supply chain issues are making it harder to get goods, some jobs are hard to fill, and massive stimulus has created high savings levels, all of which have caused price pressures to build. But once the reopening has taken place and these bottlenecks have cleared, we would expect inflation readings to come back down. The Fed agrees, having said for months that any higher inflation numbers will be transitory, which means things should go back to normal once we get past the shock of reopening.
Easy comparisons. In the midst of the pandemic last spring, CPI was negative three consecutive months in a row and April saw one of the largest drops ever. Now with the economy improving, comparisons from those dark days are extremely easy, likely distorting the yearly inflation numbers.
Recovery plays accounted for most of the jump. Used car and truck prices jumped a record 10%, lodging climbed 7.6%, airfare 10.2%, car rentals 16.2%, and sporting events 10.1%. All of these are heavily impacted by the reopening process and accounted for nearly all of the jump. As these prices get back to normal, we expect inflation to calm down. How many more cars can people buy? And, of course sporting events were cheaper a year ago when no one was going to them. Meanwhile, other major components of CPI, like rents (0.2%), showed much more modest increases.
Bigger forces still in play. Yes, near-term inflation has spiked, but in the longer-term a 1970s-style scare is extremely unlikely. Technology, globalization, the Amazon effect, increased productivity and efficiency, automation, and high debt (which puts downward pressure on inflation) are among the major structural forces that have put a lid on inflation the past decade plus—and will likely continue to do so.
Conclusion
The economy continues to strengthen and, so far, this year is off to a better start than even the most bullish economist could have expected. There are always risks though, including COVID-19 spread outside the U.S., deficit spending, geopolitics, inflation, tax increases, and a potential policy mistake. Not to mention after a record 89% rally for the S&P 500, a well-deserved break or consolidation during a historically weak time seasonally would be perfectly normal. But, amid a backdrop of an improving economy, massive levels of fiscal and monetary stimulus, and rising vaccination rates, we don’t expect any pullbacks to last very long, and we’d use any that appear as a buying opportunity. We upgraded our forecast for the global economy and U.S. corporate earnings in April, and last week upgraded our 2021 year-end S&P 500 fair-value target range to 4,400-4,450. We continue to recommend an overweight to equities and underweight to fixed-income position relative to investors’ targets, as appropriate. Read previous editions of Weekly Market Commentary on lpl.com at News & Media. Ryan Detrick, CMT, Chief Market Strategist, LPL Financial
Barry Gilbert, PhD, CFA, Asset Allocation Strategist, LPL Financial ______________________________________________________________________________________________ IMPORTANT DISCLOSURES This material is for general information only and is not intended to provide specific advice or recommendations for any individual. There is no assurance that the views or strategies discussed are suitable for all investors or will yield positive outcomes. Investing involves risks including possible loss of principal. Any economic forecasts set forth may not develop as predicted and are subject to change. References to markets, asset classes, and sectors are generally regarding the corresponding market index. Indexes are unmanaged statistical composites and cannot be invested into directly. Index performance is not indicative of the performance of any investment and do not reflect fees, expenses, or sales charges. All performance referenced is historical and is no guarantee of future results. Any company names noted herein are for educational purposes only and not an indication of trading intent or a solicitation of their products or services. LPL Financial doesn’t provide research on individual equities. All information is believed to be from reliable sources; however, LPL Financial makes no representation as to its completeness or accuracy. US Treasuries may be considered “safe haven” investments but do carry some degree of risk including interest rate, credit, and market risk. Bonds are subject to market and interest rate risk if sold prior to maturity. Bond values will decline as interest rates rise and bonds are subject to availability and change in price. The Standard & Poor’s 500 Index (S&P500) is a capitalization-weighted index of 500 stocks designed to measure performance of the broad domestic economy through changes in the aggregate market value of 500 stocks representing all major industries. The PE ratio (price-to-earnings ratio) is a measure of the price paid for a share relative to the annual net income or profit earned by the firm per share. It is a financial ratio used for valuation: a higher PE ratio means that investors are paying more for each unit of net income, so the stock is more expensive compared to one with lower PE ratio. Earnings per share (EPS) is the portion of a company’s profit allocated to each outstanding share of common stock. EPS serves as an indicator of a company’s profitability. Earnings per share is generally considered to be the single most important variable in determining a share’s price. It is also a major component used to calculate the price-to-earnings valuation ratio. All index data from FactSet. Please read the full Outlook 2021: Powering Forward publication for additional description and disclosure. This research material has been prepared by LPL Financial LLC. Securities and advisory services offered through LPL Financial (LPL), a registered investment advisor and broker-dealer (member FINRA/SIPC). Insurance products are offered through LPL or its licensed affiliates. To the extent you are receiving investment advice from a separately registered independent investment advisor that is not an LPL affiliate, please note LPL makes no representation with respect to such entity. Not Insured by FDIC/NCUA or Any Other Government Agency | Not Bank/Credit Union Guaranteed | Not Bank/Credit Union Deposits or Obligations | May Lose Value
RES-749550-0521 | For Public Use | Tracking # 1-05144622 (Exp. 05/22)
On May 27, 2021, a couple of events in the energy sector occurred that demonstrated the continued mainstreaming of sustainable investing and underscored the risks and opportunities available to investors. While primarily thought of as equity-oriented, sustainable investing is becoming more mainstream in fixed income markets—and companies that fail to acknowledge changing dynamics may potentially face financially material impacts.
Sustainable Investing
Sustainable investing is an umbrella term to describe a range of investment practices that seek competitive financial returns and purposefully consider environmental, social, and governance (ESG) risks and opportunities. Approaches such as socially responsible investing (SRI), ESG investing, and impact investing all fall under this umbrella. These three approaches align with investors’ primary motivations for considering sustainable investing – aligning with international norms/values, improving risk-adjusted returns, and providing a positive impact on society.
Transition Risks
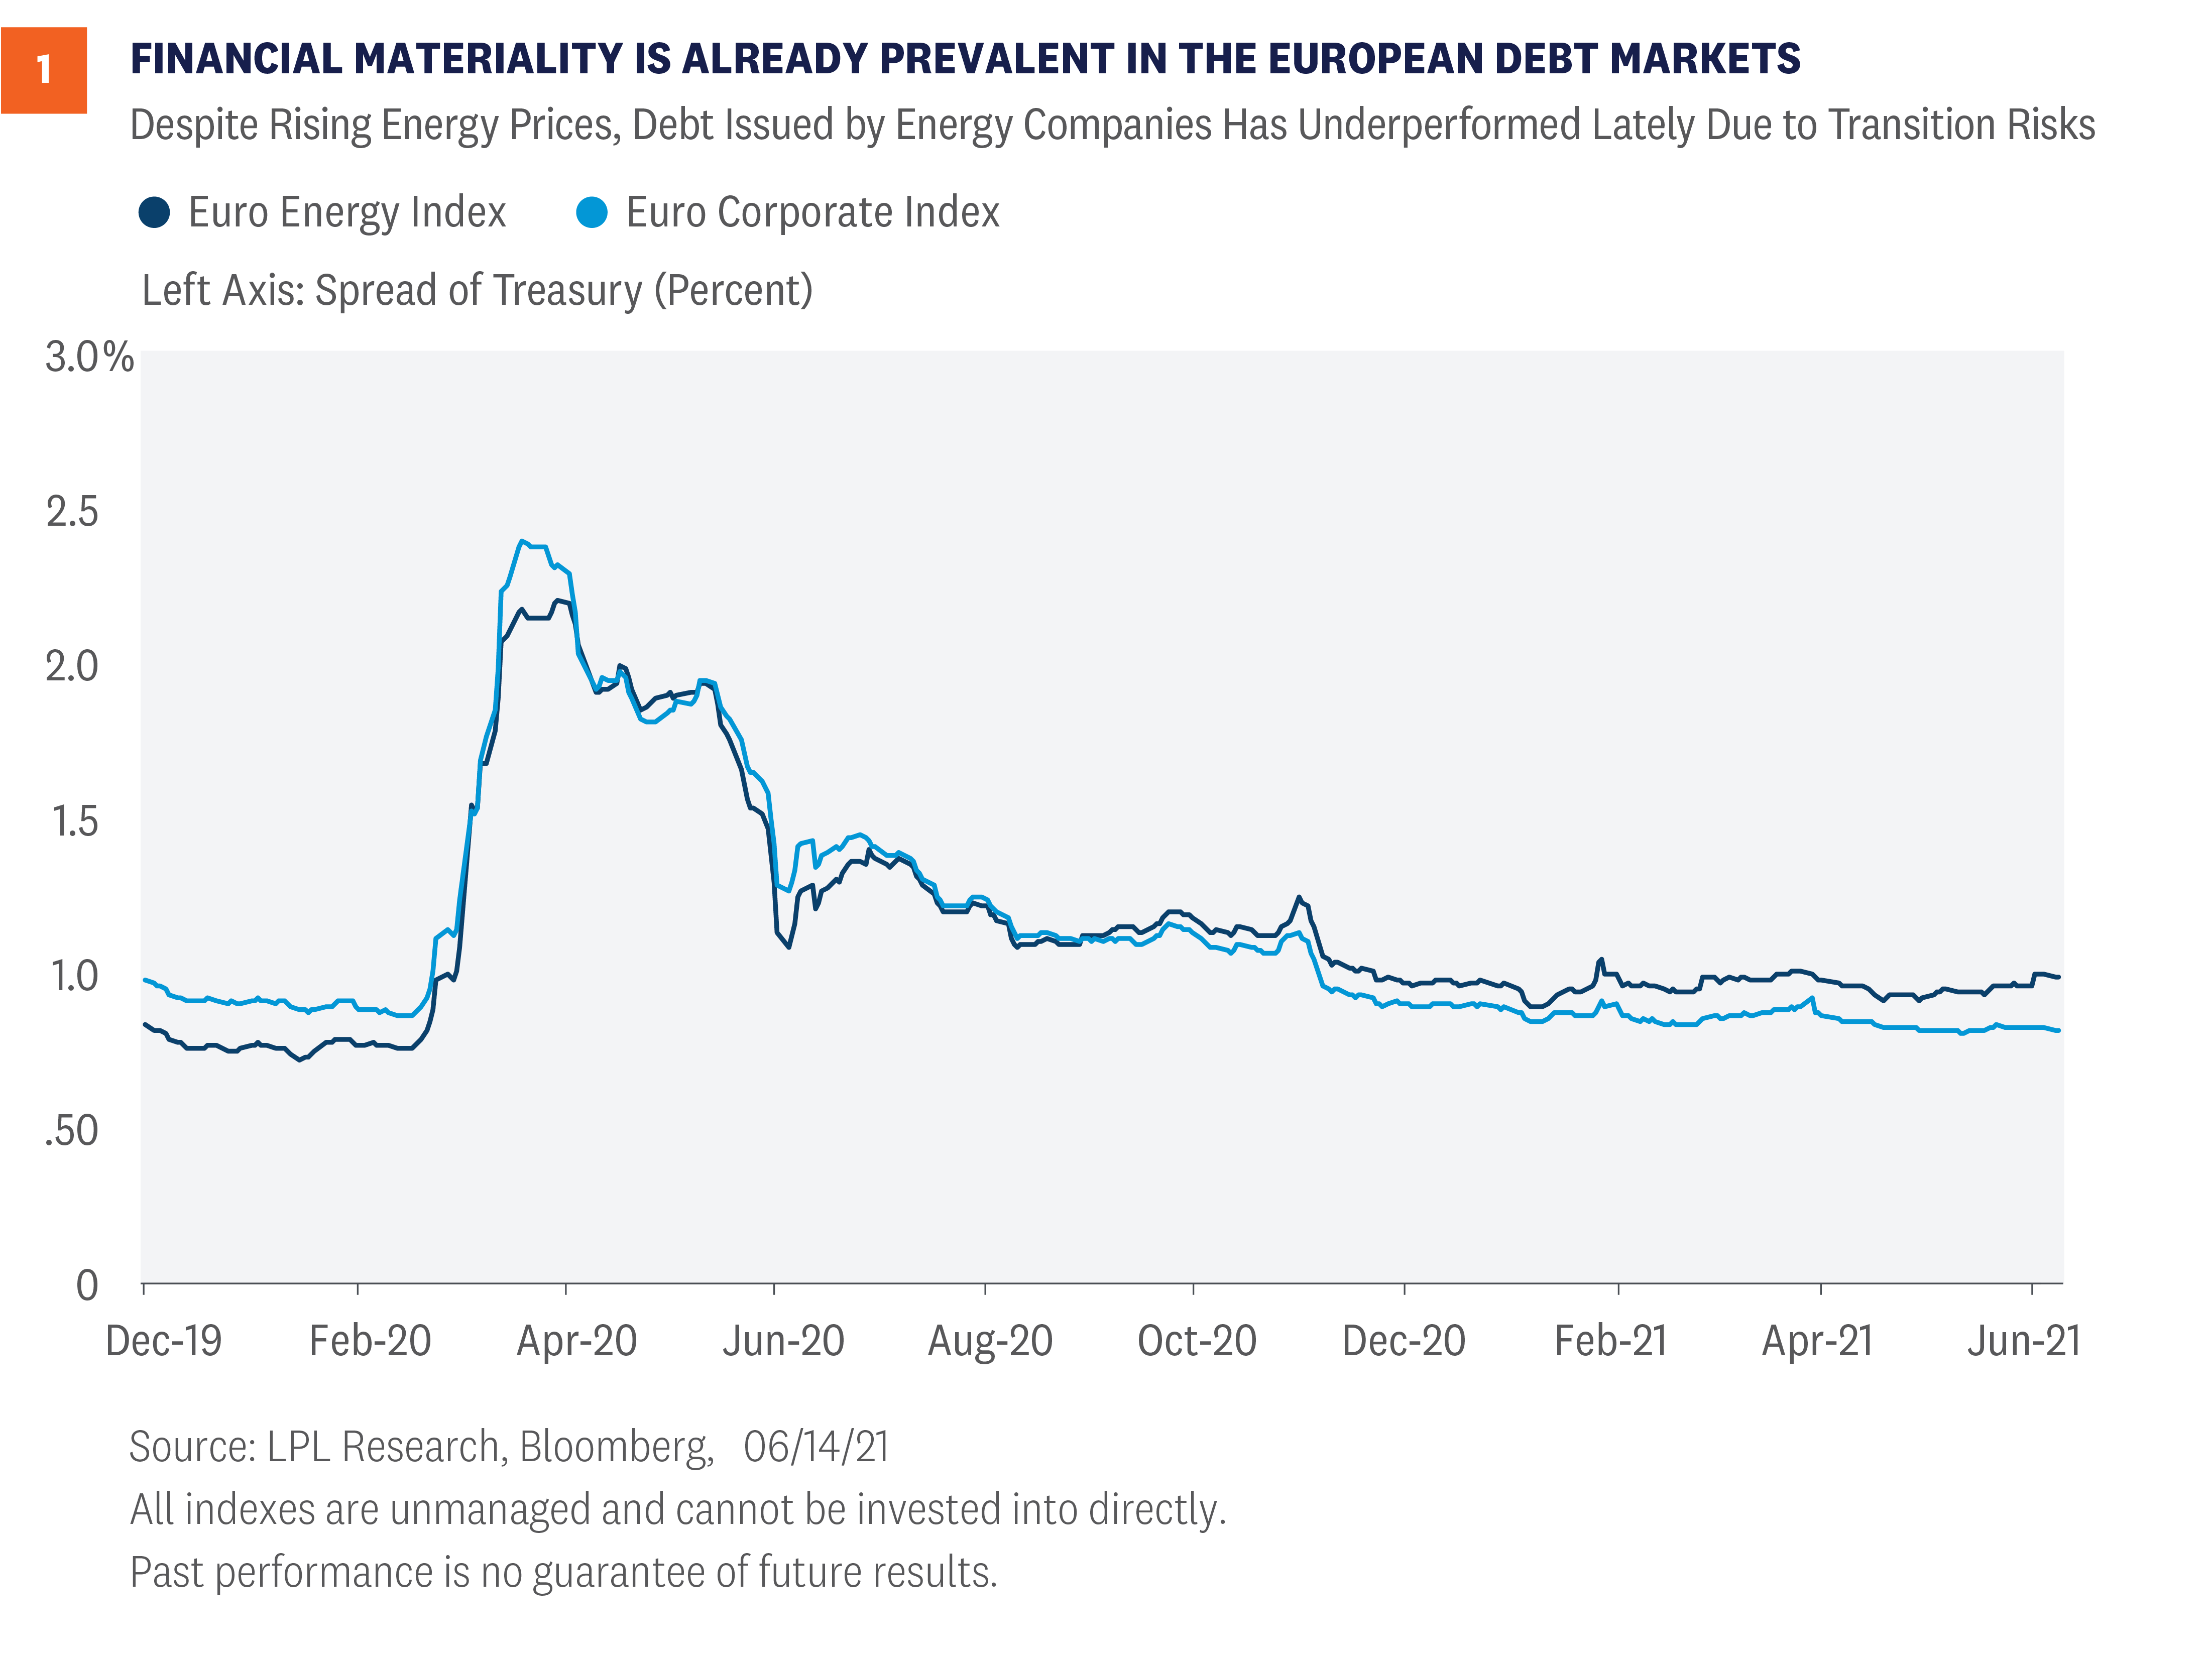
Equity returns in the energy sector have led the S&P 500 Index during 2021 as crude oil prices have soared and, on the surface, seem to show little concern for oil and gas companies’ approach to managing climate risks. However, energy sector bond investors appear to be reevaluating their holdings to get ahead of possible changes. Bond investors, who typically have a longer investment horizon, are increasingly having to consider the financial materiality of climate change. On May 27, a Dutch court ruled that Royal Dutch Shell PLC needed to slash its carbon emissions 45% by 2030, a move that illustrates the increased pressure from governments to speed up the transition to a low-carbon economy. On the same day, Exxon Mobil Corp. shareholders elected board members who were nominated by a coalition of investors demanding that the company speed up its plans to transition to a low-carbon economy. Both of these decisions accentuate the changing investment dynamics for how investors look at oil and gas companies. Transition risks resulting from changes in climate and energy policies, a shift to low-carbon technologies, and liability issues may negatively impact the cost of capital for oil and gas companies. Even as crude oil prices have soared, bonds have lost value. As seen in [Figure 1], Euro-area energy bonds have underperformed Euro-area corporate bonds. Global fixed income credit markets have seen credits spreads, a measure of credit risk, compress this year due to a recovering economy and the continued search for yield. Energy bond sector underperformance is notable and speaks to the financial consequences for companies that are lagging in adjusting to the risks associated with a transition to a low carbon economy. Moreover, energy companies will likely continue to see their costs to issue debt increase as rating agencies are increasingly incorporating transition risks into their rating decisions. S&P, one of the main bond rating agencies, recently put the oil and gas industry at “moderately high risk,” citing concerns about energy transition risks. Analysis by Bloomberg suggests that approximately $156 billion of North American and European oil debt is at risk of downgrade. Lowered credit ratings generally mean higher capital costs on new and refinanced debt.
Opportunities
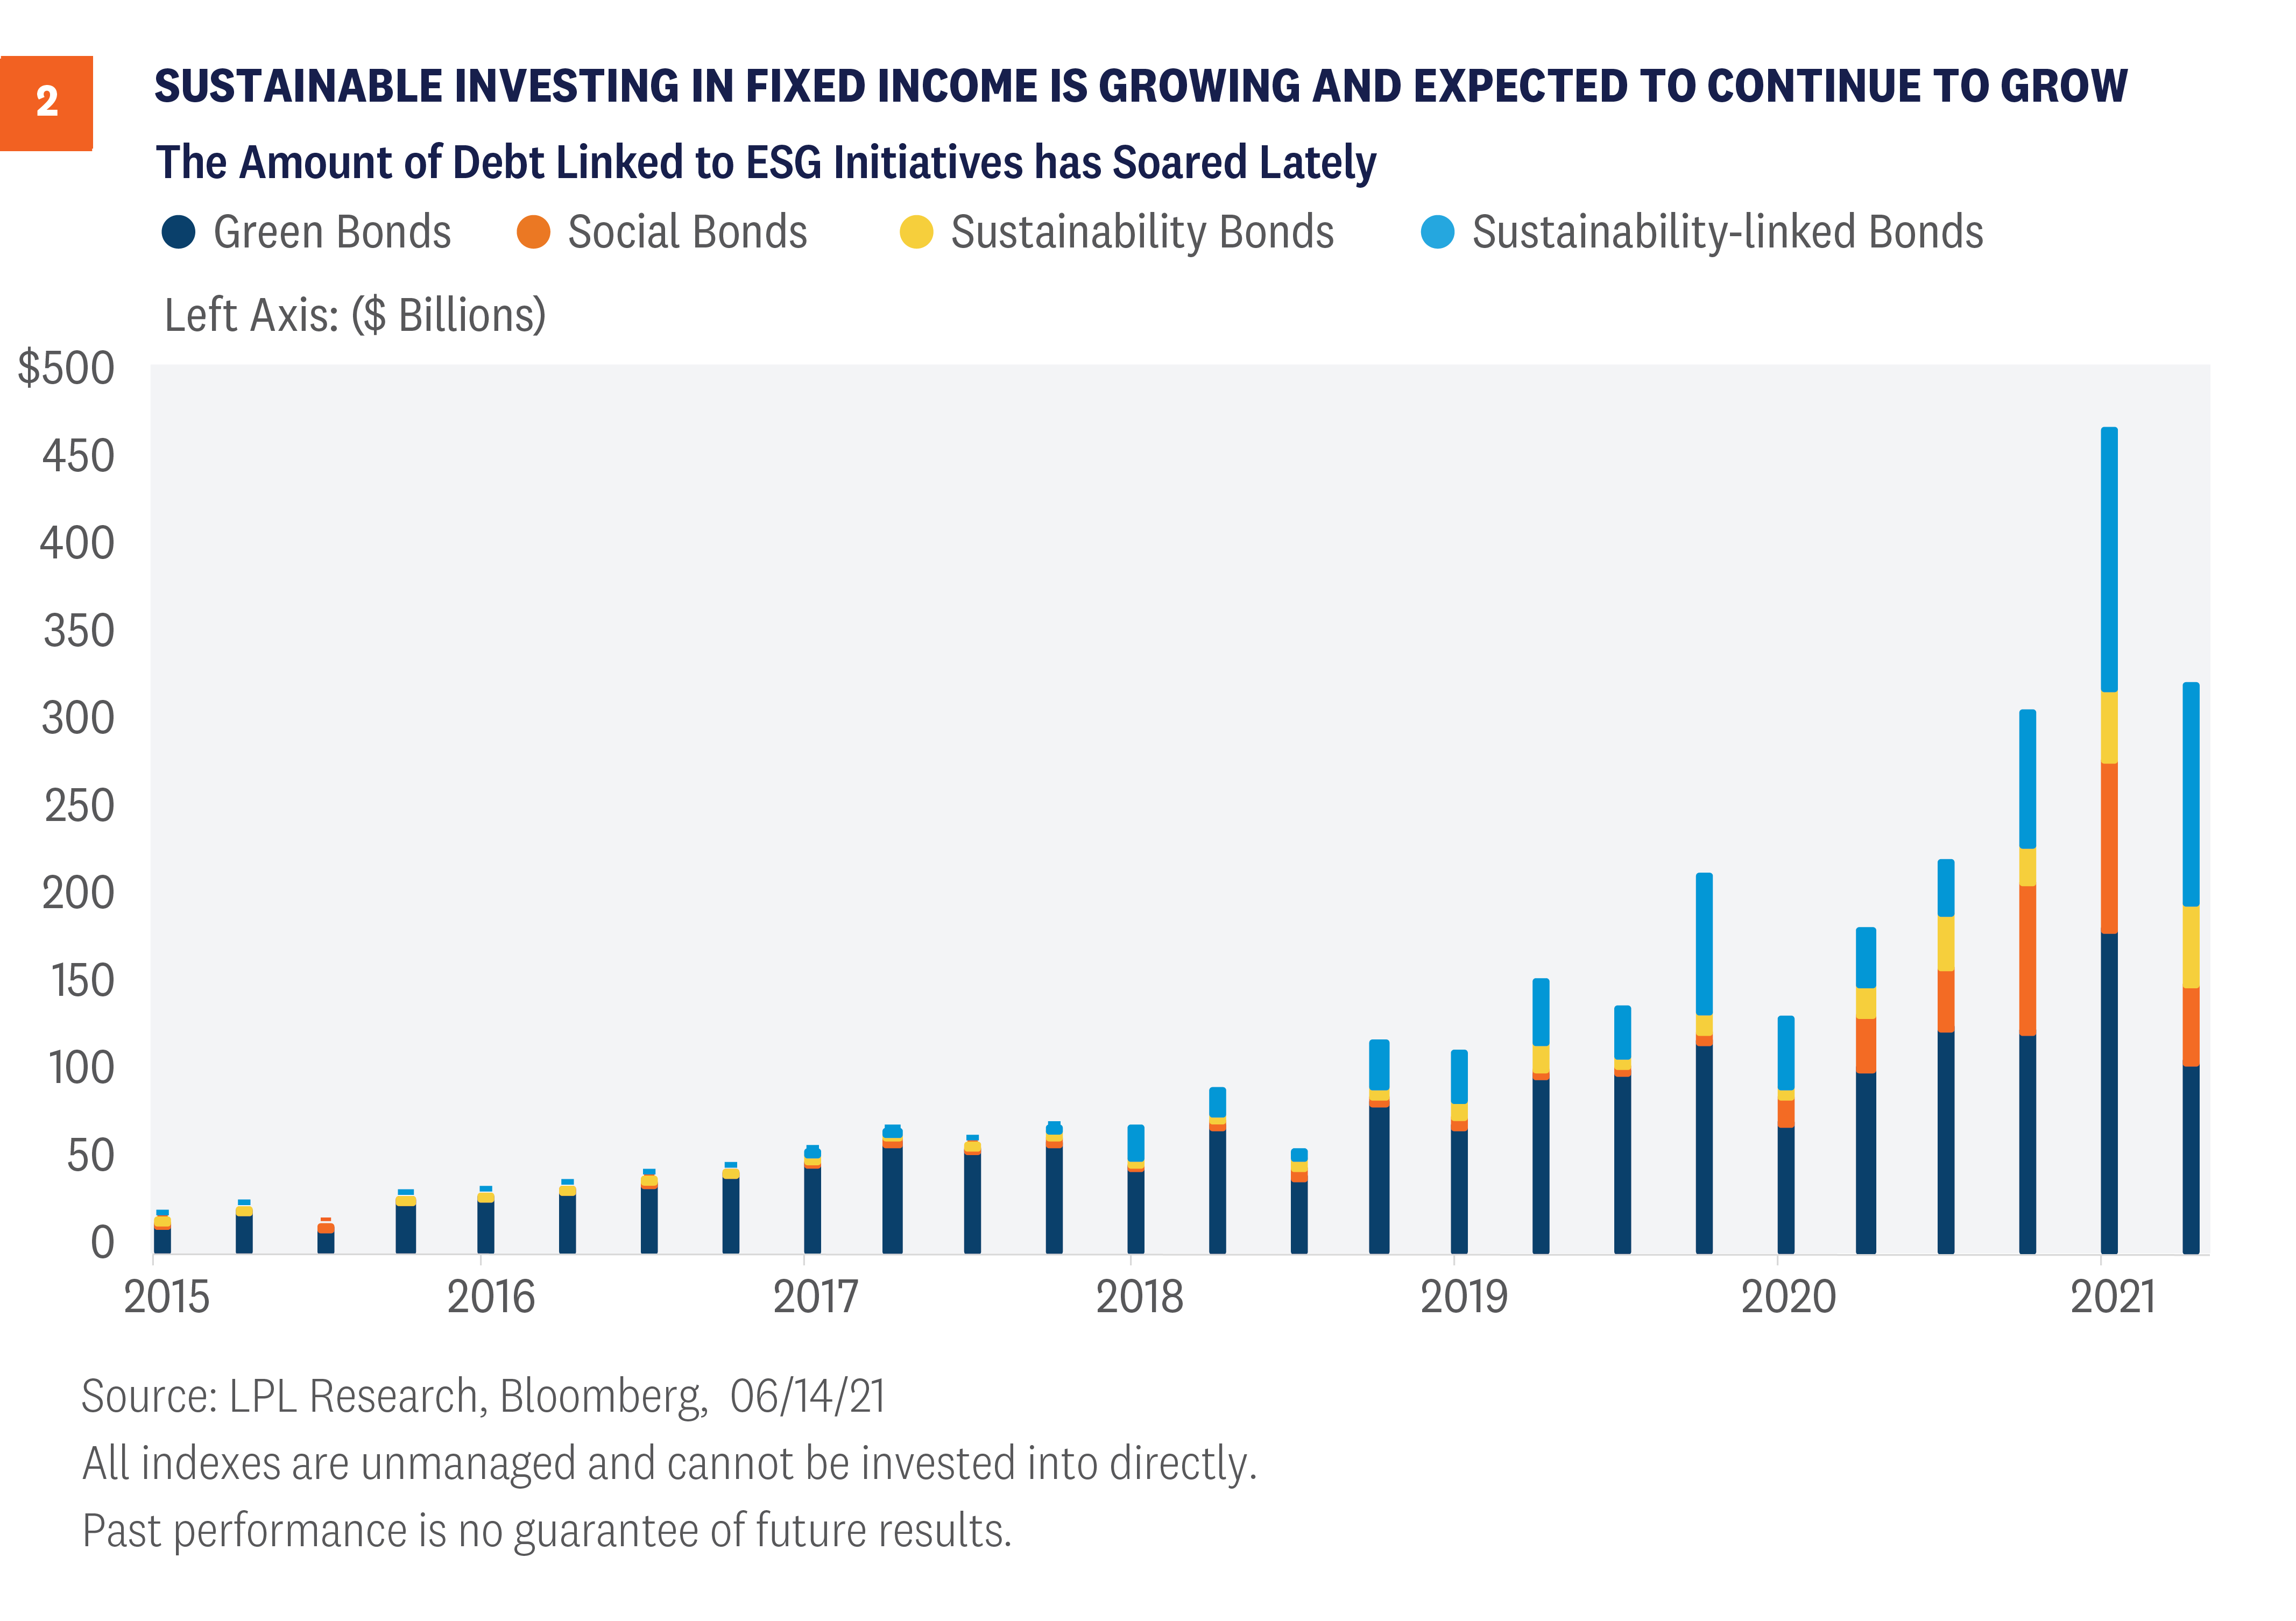
Many attribute this contrast between the energy equity and bond markets to the positioning of large purchasers of bonds, including central banks, sovereign wealth funds, insurers, and pension funds. For context, during 2020, the European Central Bank (ECB) purchased $105 billion, the Bank of England over $13 billion, and the U.S. Federal Reserve nearly $5 billion of corporate bonds through their stimulus programs. Some central banks have indicated that they would consider their role in reducing carbon emissions when selecting corporate bonds. In March of this year, the Bank of England indicated that it would adjust its corporate bond buying program to account for the climate impact of issuers and discontinue subsidizing polluting industries. Additionally, other large asset owners such as corporate pension funds, insurance companies, and mutual funds are also increasingly moving assets to debt linked to ESG initiatives. Over 2,300 organizations, representing over USD $80 trillion in assets under management (AUM), have signed the United Nations Principles of Responsible Investing. While certainly not all fixed income related, the sheer size of AUM interested in sustainable investing will impact fixed income markets broadly. As such, the general make-up of debt markets will continue to evolve and, we think, will include a growing share of debt linked to ESG risks and opportunities. As seen in [Figure 2], the data certainly seems to back up our current thinking. Since 2015, the amount of debt linked to ESG projects has continued to grow. For the entirety of 2015, debt issued to support ESG projects totaled around $80 billion. Now, we’re seeing multiplies of that every quarter! Over $400 billion of ESG related debt was issued in the first quarter of 2021 alone. Moreover, debt structures continue to evolve. What was once a market denominated by Green Bonds has now evolved into debt that holds companies more accountable for their sustainability efforts. For example, sustainability-linked bonds have coupons that reset based upon certain sustainability performance targets. Meaning, if companies don’t meet their sustainability goals, their debt costs go up (generally by 0.25% a year). Again, these are real costs to companies that fail to uphold their sustainability commitments. That the debt structures continue to evolve allows investors to target issuers with clearly defined goals and objectives, which serves to broaden the appetite for ESG-linked debt.
Conclusion
While the evolution of sustainable investing has impacted the equity markets and is often discussed, sustainable investing in the fixed income landscape is changing as well. As providers of capital, fixed income investors play a key role in shaping the future of sustainable investing. Transition risks are real risks to debt issuers, and those borrowers that fail to recognize this changing dynamic are likely to see higher borrowing costs. The appetite for ESG-linked debt continues to grow and, likewise, issuance trends are increasing to satisfy that demand. Moreover, large asset owners, including central banks, sovereign wealth funds, and pension plans, are increasingly incorporating sustainability in their decision-making process, showing that this trend itself is likely sustainable. Read previous editions of Weekly Market Commentary on lpl.com at News & Media. Jason Hoody, CFA, Head of Sustainable Investing, LPL Financial
Lawrence Gillum, CFA, Fixed Income Strategist, LPL Financial ______________________________________________________________________________________________ IMPORTANT DISCLOSURES This material is for general information only and is not intended to provide specific advice or recommendations for any individual. There is no assurance that the views or strategies discussed are suitable for all investors or will yield positive outcomes. Investing involves risks including possible loss of principal. Any economic forecasts set forth may not develop as predicted and are subject to change. References to markets, asset classes, and sectors are generally regarding the corresponding market index. Indexes are unmanaged statistical composites and cannot be invested into directly. Index performance is not indicative of the performance of any investment and do not reflect fees, expenses, or sales charges. All performance referenced is historical and is no guarantee of future results. Any company names noted herein are for educational purposes only and not an indication of trading intent or a solicitation of their products or services. LPL Financial doesn’t provide research on individual equities. All information is believed to be from reliable sources; however, LPL Financial makes no representation as to its completeness or accuracy. US Treasuries may be considered “safe haven” investments but do carry some degree of risk including interest rate, credit, and market risk. Bonds are subject to market and interest rate risk if sold prior to maturity. Bond values will decline as interest rates rise and bonds are subject to availability and change in price. The Standard & Poor’s 500 Index (S&P500) is a capitalization-weighted index of 500 stocks designed to measure performance of the broad domestic economy through changes in the aggregate market value of 500 stocks representing all major industries. The PE ratio (price-to-earnings ratio) is a measure of the price paid for a share relative to the annual net income or profit earned by the firm per share. It is a financial ratio used for valuation: a higher PE ratio means that investors are paying more for each unit of net income, so the stock is more expensive compared to one with lower PE ratio. Earnings per share (EPS) is the portion of a company’s profit allocated to each outstanding share of common stock. EPS serves as an indicator of a company’s profitability. Earnings per share is generally considered to be the single most important variable in determining a share’s price. It is also a major component used to calculate the price-to-earnings valuation ratio. All index data from FactSet. This research material has been prepared by LPL Financial LLC. Securities and advisory services offered through LPL Financial (LPL), a registered investment advisor and broker-dealer (member FINRA/SIPC). Insurance products are offered through LPL or its licensed affiliates. To the extent you are receiving investment advice from a separately registered independent investment advisor that is not an LPL affiliate, please note LPL makes no representation with respect to such entity. Not Insured by FDIC/NCUA or Any Other Government Agency | Not Bank/Credit Union Guaranteed | Not Bank/Credit Union Deposits or Obligations | May Lose Value
RES-785325-0621 | For Public Use | Tracking # 1-05154602 (Exp. 06/22)
After one of the worst starts to a year for fixed income, returns may not get much better from here. Long-term interest rates have traded sideways recently but we expect rates to potentially rise further, which would put downward pressure on bond prices. We’re not giving up on high-quality fixed income though, as Treasury securities have shown to be the best diversifier during times of equity market stresses.
The Case for (still) Higher Treasury Yields
Interest rates have moved off their very low levels to start the year, but we think they can go higher. Higher inflation expectations, less involvement in the bond market by the Federal Reserve (more on this below), and a record amount of Treasury issuance this year are all reasons why we believe interest rates can move higher. We think the 10-year Treasury yield could end the year between 1.75% and 2.0%. Inflationary pressures are building as the economy continues to recover. As one of bondholders’ main nemeses, inflation, erodes the “real” value of principal and interest payments, making them worth less. While we don’t believe inflation will be a lasting problem, we do expect higher consumer prices in the near term, which should nudge interest rates higher over the rest of this year. Moreover—and why we believe copper is an important commodity to watch, as seen in [Figure 1]—the ratio of copper prices to gold prices has been an important predictor of where the yield of the 10-year Treasury should be. Copper is an important input price for a number of products so, while copper prices have increased due to the strengthening of the global economy, 10-year Treasury yields haven’t kept up. While not a perfect predictor, the copper/gold ratio has been a fairly reliable one—and one that suggests interest rates can move higher than current levels.
Stalling Out
Rising Treasury yields have been a headwind to core fixed income returns this year. Generally speaking, the yield spread between Treasury securities and non-Treasury bond securities can help cushion losses when interest rates move higher (and bond prices fall). However, with valuations within most fixed income sectors already at lofty levels, there hasn’t been enough spread to offset rising Treasury yields. This has caused the prices of many bond sectors to fall as interest rates have moved higher. Unfortunately, we expect the trend of higher interest rates to continue, albeit at a much slower pace than what we’ve already experienced so far this year, putting further downward pressure on core fixed income returns. As seen in [Figure 2], expected returns for core fixed income (as defined by the Bloomberg Barclays U.S. Aggregate Bond Index) through the remainder of the year are low to even negative in certain scenarios. Because we believe interest rates will move higher from current levels, core fixed income returns may add more negative returns to the already negative year-to-date returns. If core fixed income returns are negative for the year, it will be the first time since 2013, which was the last time the Federal Reserve (Fed) started talking about tapering its bond buying programs. History may be rhyming again.
Portfolio Protection During Market Sell-Offs
So, if we’re expecting higher Treasury yields and low-to-negative returns for core fixed income, why would anyone want to own bonds? Frankly, in case something bad happens to cause equity markets to sell off. Core bonds, and more specifically Treasury securities, have shown to be the best diversifier to equity market declines. [Figure 3] shows the monthly returns of the Treasury index during months when the S&P 500 Index was down 3% or more during the month. When we look at how Treasury securities have performed during periods of equity market selloffs, we can see that Treasury security returns have been mostly positive. When you consider stocks are in the second year of a bull market which, historically, has brought increased volatility, core fixed income can help dampen and potentially offset some of those losses. While we still like equities over bonds over the course of the year, we do think high-quality fixed income continues to serve a purpose in portfolios.
All Eyes on the Federal Reserve
When we evaluate the economic and financial landscapes, the Fed is a key risk we’re keeping our eyes on. Since March 2020, the Fed has supported the economy and financial markets by purchasing $120 billion in Treasury and mortgage securities, and by keeping short-term interest rates near zero. As the economy continues to recover, however, the need for continued monetary support wanes. While we still think it’s too early for the Fed to begin to increase short-term interest rates, we do think the discussion around reducing the size and scope of bond purchases will start to take place soon. How the market will react to these discussions is unclear at this point, and the policy risk associated with a possible communication error by the Fed is a risk that could cause interest rates to move higher.
Conclusion
Core fixed income returns have—not unexpectedly—been negative so far this year. With long-term interest rates near historical lows coming into the year and the economy on the mend, we thought interest rates would move higher this year—and they have. We think long-term interest rates still have room to move higher even after the big move this year, so bonds may experience subpar returns throughout the rest of the year. We still think high-quality bonds play a pivotal role in portfolios as a diversifier to equity risk. While we expect further gains for stocks through year-end, unforeseen events happen. And it’s best to have that potential portfolio protection in place before it’s needed.
Read previous editions of Weekly Market Commentary on lpl.com at News & Media. Ryan Detrick, CMT, Chief Market Strategist, LPL Financial
Lawrence Gillum, CFA, Fixed Income Strategist, LPL Financial ______________________________________________________________________________________________ IMPORTANT DISCLOSURES This material is for general information only and is not intended to provide specific advice or recommendations for any individual. There is no assurance that the views or strategies discussed are suitable for all investors or will yield positive outcomes. Investing involves risks including possible loss of principal. Any economic forecasts set forth may not develop as predicted and are subject to change. References to markets, asset classes, and sectors are generally regarding the corresponding market index. Indexes are unmanaged statistical composites and cannot be invested into directly. Index performance is not indicative of the performance of any investment and do not reflect fees, expenses, or sales charges. All performance referenced is historical and is no guarantee of future results. Any company names noted herein are for educational purposes only and not an indication of trading intent or a solicitation of their products or services. LPL Financial doesn’t provide research on individual equities. All information is believed to be from reliable sources; however, LPL Financial makes no representation as to its completeness or accuracy. US Treasuries may be considered “safe haven” investments but do carry some degree of risk including interest rate, credit, and market risk. Bonds are subject to market and interest rate risk if sold prior to maturity. Bond values will decline as interest rates rise and bonds are subject to availability and change in price. The Standard & Poor’s 500 Index (S&P500) is a capitalization-weighted index of 500 stocks designed to measure performance of the broad domestic economy through changes in the aggregate market value of 500 stocks representing all major industries. The PE ratio (price-to-earnings ratio) is a measure of the price paid for a share relative to the annual net income or profit earned by the firm per share. It is a financial ratio used for valuation: a higher PE ratio means that investors are paying more for each unit of net income, so the stock is more expensive compared to one with lower PE ratio. Earnings per share (EPS) is the portion of a company’s profit allocated to each outstanding share of common stock. EPS serves as an indicator of a company’s profitability. Earnings per share is generally considered to be the single most important variable in determining a share’s price. It is also a major component used to calculate the price-to-earnings valuation ratio. All index data from FactSet. Please read the full Outlook 2021: Powering Forward publication for additional description and disclosure. This research material has been prepared by LPL Financial LLC. Securities and advisory services offered through LPL Financial (LPL), a registered investment advisor and broker-dealer (member FINRA/SIPC). Insurance products are offered through LPL or its licensed affiliates. To the extent you are receiving investment advice from a separately registered independent investment advisor that is not an LPL affiliate, please note LPL makes no representation with respect to such entity. Not Insured by FDIC/NCUA or Any Other Government Agency | Not Bank/Credit Union Guaranteed | Not Bank/Credit Union Deposits or Obligations | May Lose Value
RES-771250-0521 | For Public Use | Tracking # 1-05148588 (Exp. 06/22)
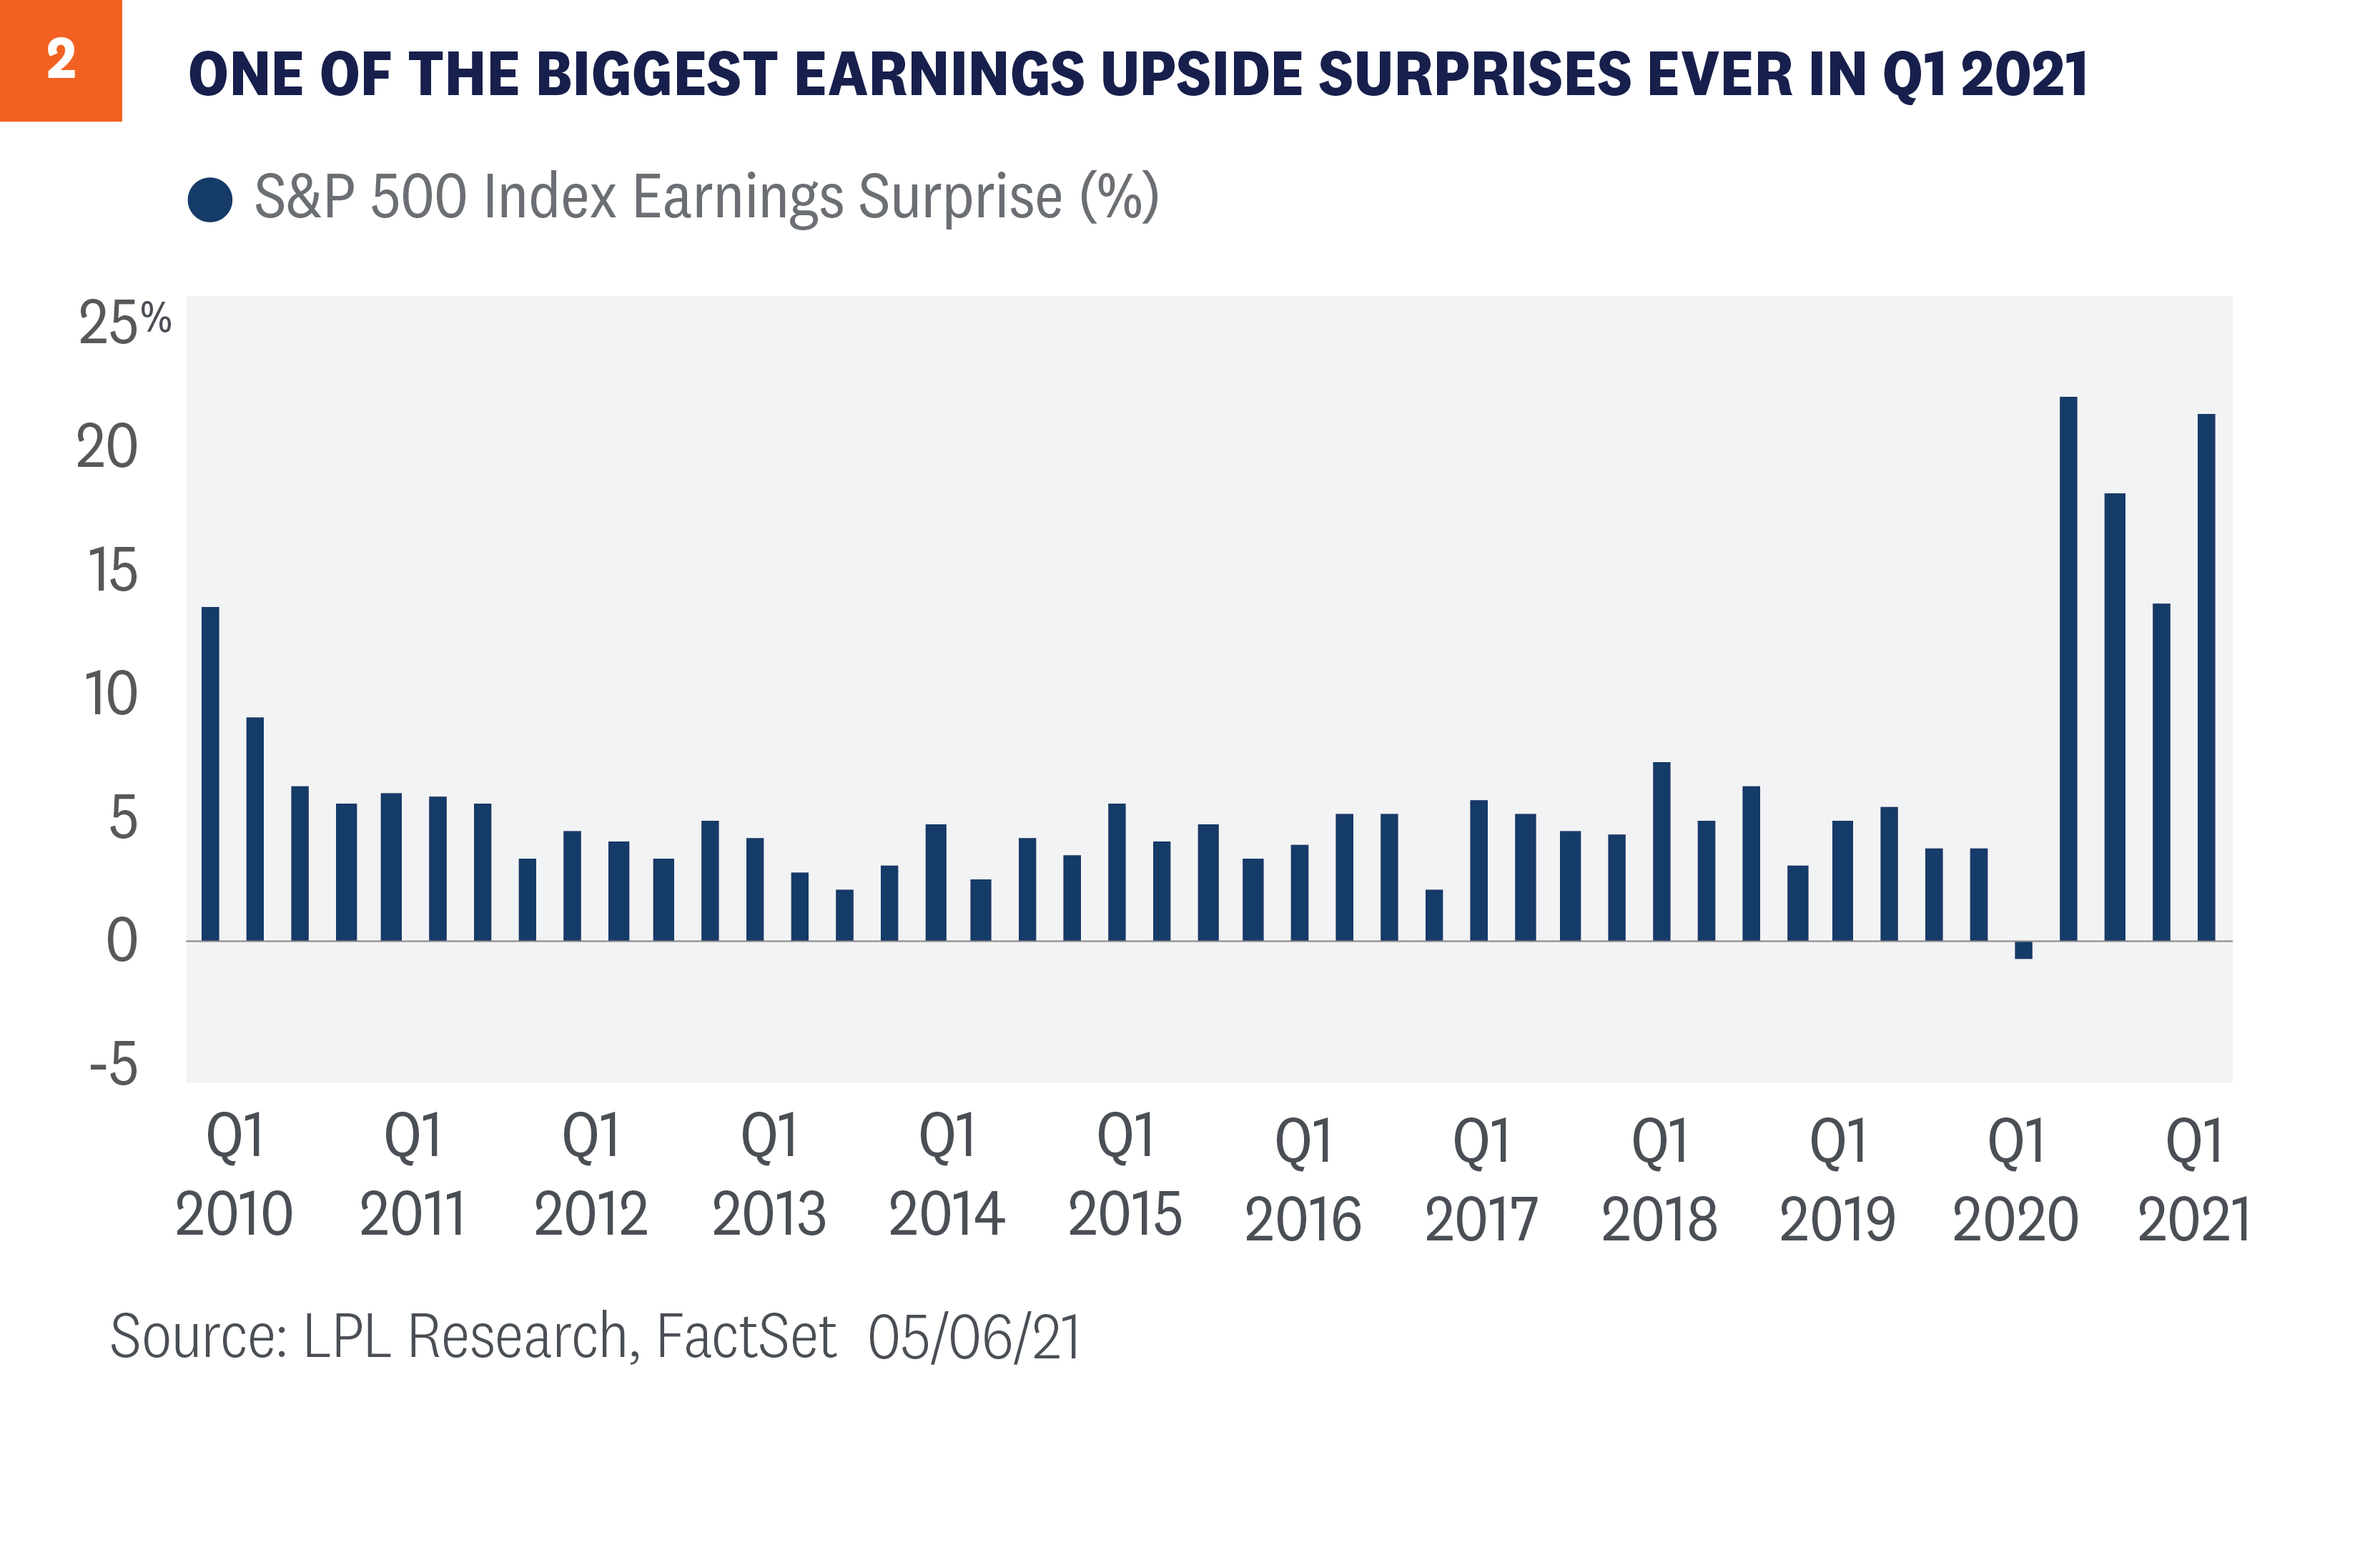
It’s embarrassing to admit this but in our earnings season preview on April 12, when the consensus estimate reflected a nearly 24% increase, we wrote that S&P 500 Index earnings growth for the first quarter could potentially exceed 30%. Fast forward to today and earnings growth for the quarter is on pace to double—yes, double—that 24% growth rate, which would mark one of the biggest upside surprises ever recorded. Here we look at how corporate America produced such a blowout earnings season and what it could mean for the outlook.
Blowout Numbers
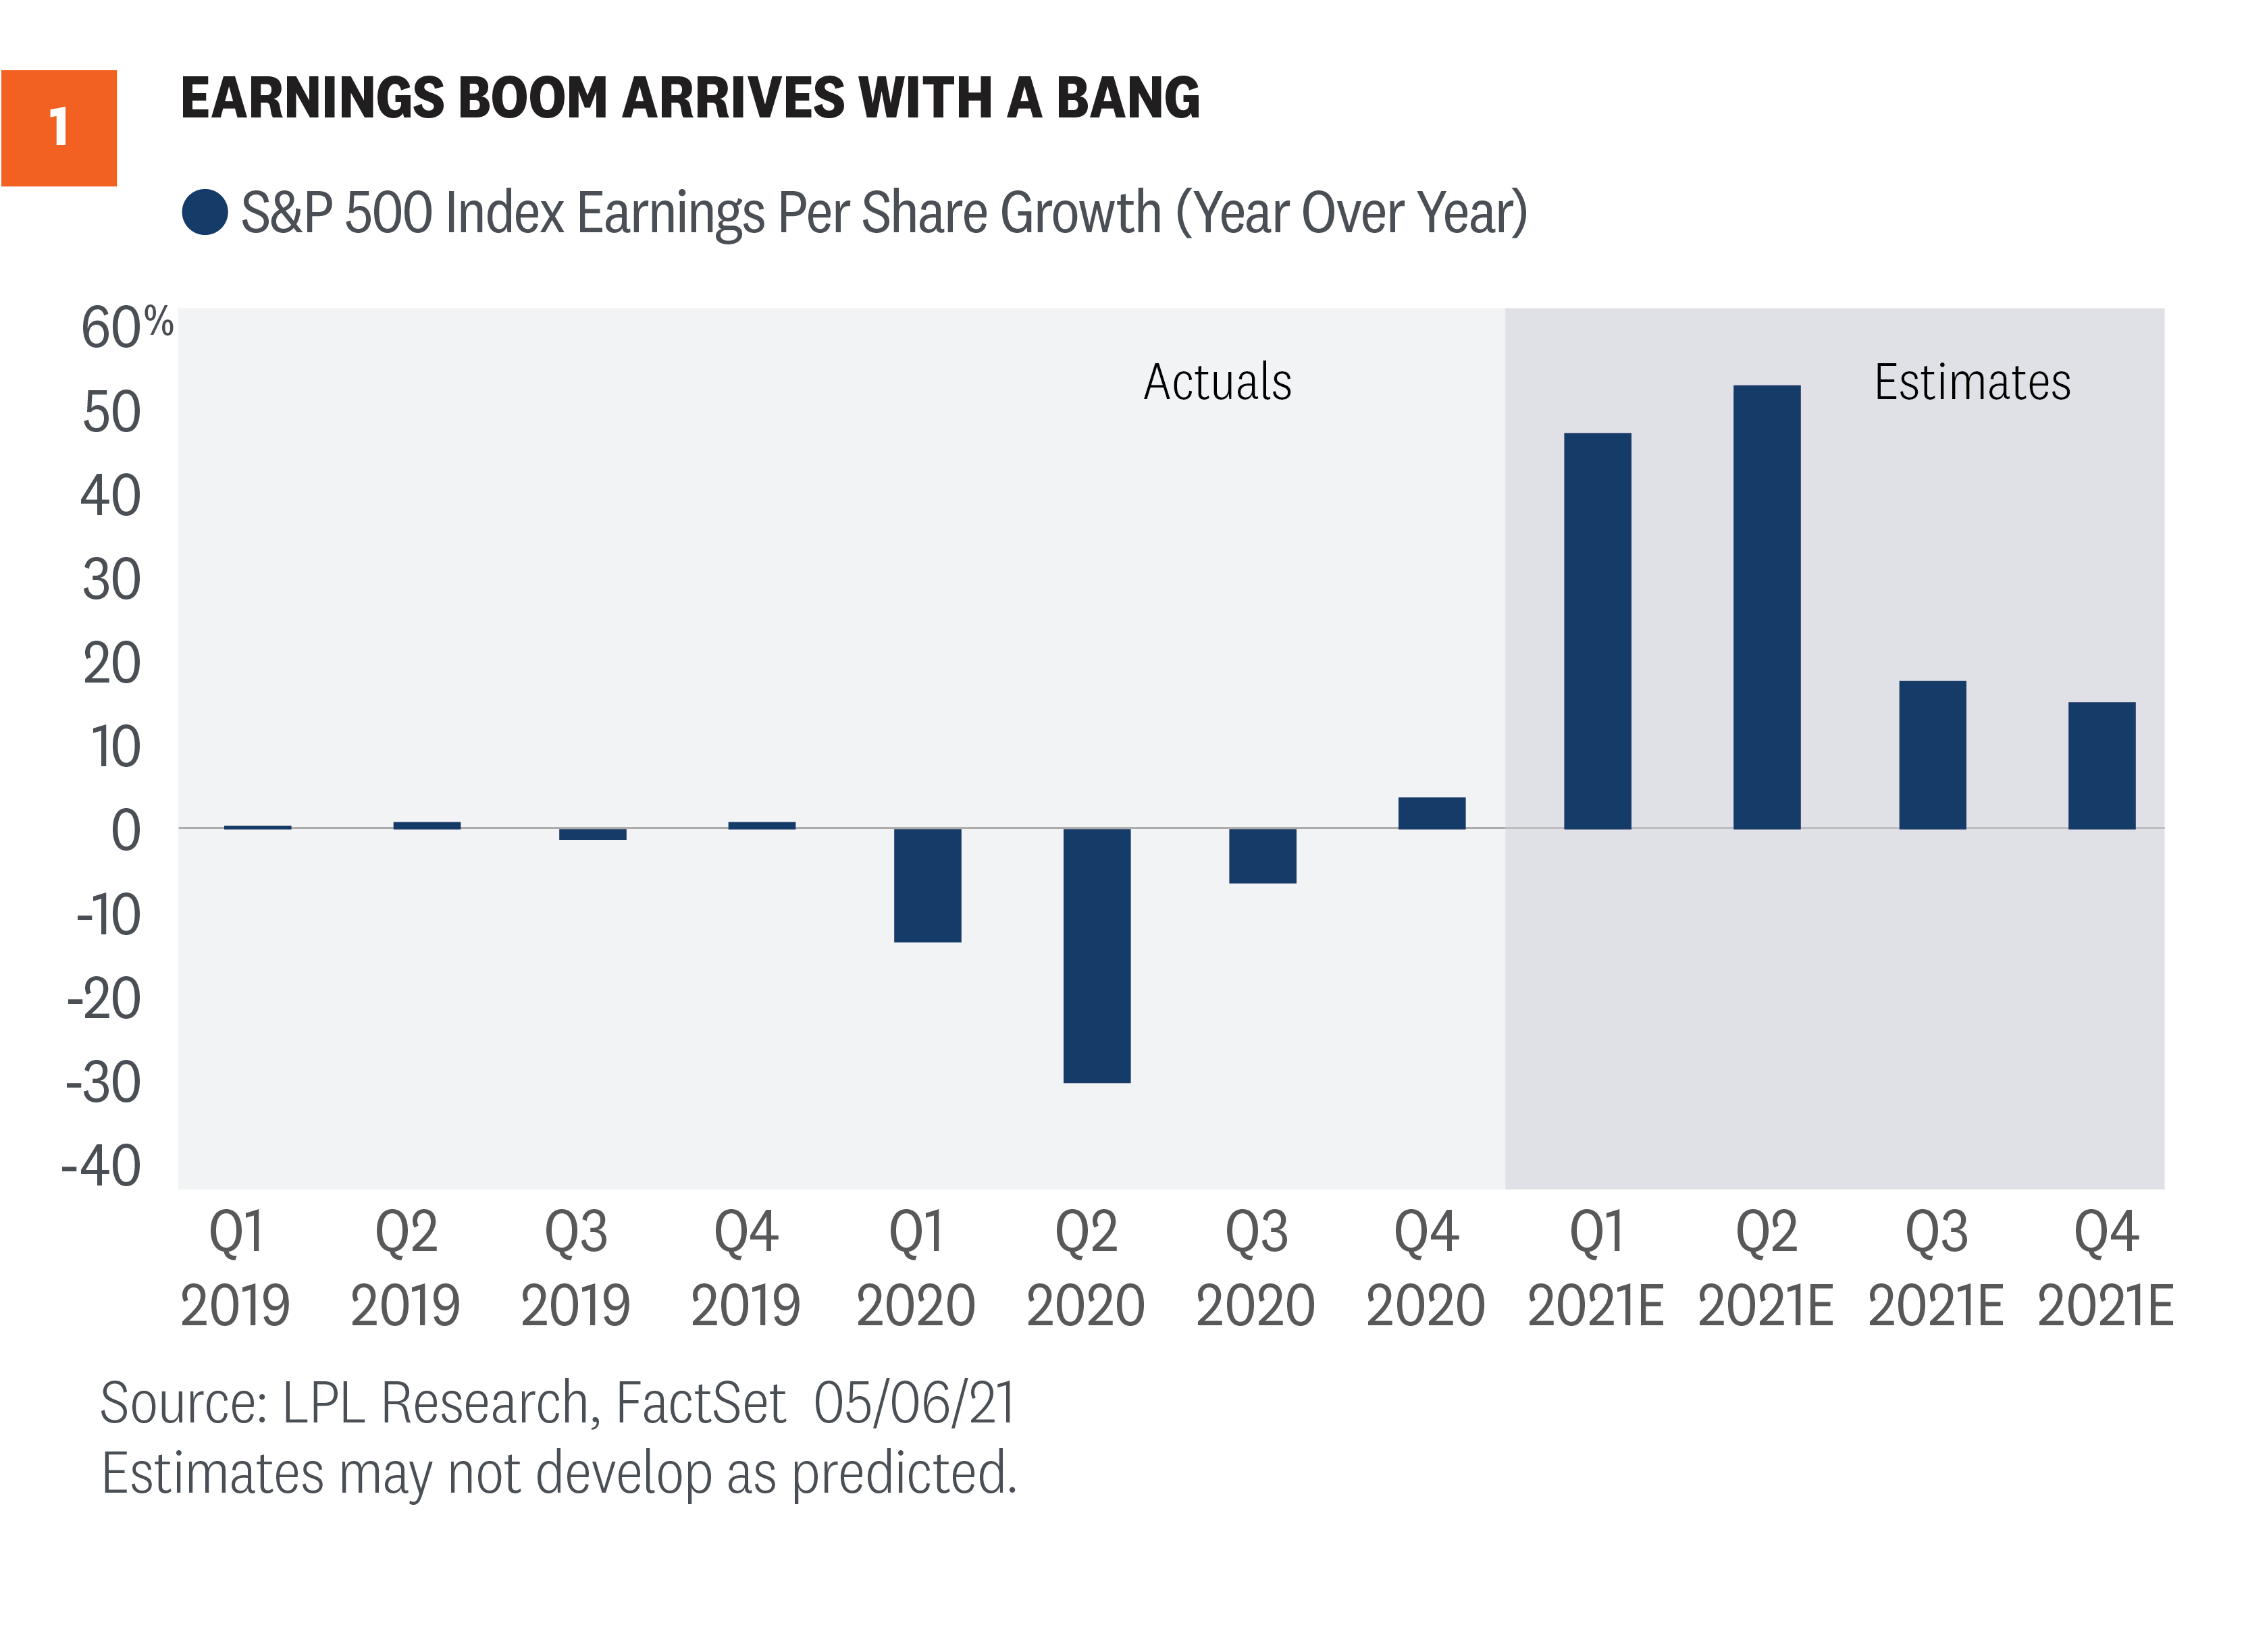
To call this earnings season a blowout would be an understatement. We wrote in our earnings preview that the combination of strengthening economic growth, booming manufacturing activity, rising estimates and positive guidance could potentially lead to double-digit upside, which implied earnings growth of about 35%. As shown in [Figure 1], with nearly 90% of S&P 500 constituents having reported, S&P 500 earnings growth is tracking to a 49% year-over-year increase. We’ve been closely following these earnings numbers for well over a decade and have never been more surprised by the amount of upside than we were this earnings season. Analysts’ estimates have historically been too conservative coming out of recessions. They tend to miss turns in economic conditions, they underestimate companies’ ability to adapt to changing conditions, and guidance from corporate management teams tends to be conservative. But after three quarters of huge upside surprises (the second, third and fourth quarters of 2020), we expected analysts to catch up. Clearly, they haven’t—because the 13 percentage points of upside to fourth-quarter earnings is being followed by a 23-percentage-point upside surprise so far for the first quarter of 2021 [Figure 2]. Keep in mind the average upside going back to 2010 is 6%. That 23 points is enormous. Revenue upside was even more impressive (if you can believe that), as stronger economic growth helped drive the biggest upside surprise to revenue ever recorded at over 4 percentage points. Pandemic winner technology contributed most to the revenue upside and grew revenue 21%, the fastest of all S&P 500 sectors.
Where Did All This Strength Come From?
We attribute the earnings strength to a number of factors:
Reopening progress. The biggest earnings upside surprises for the quarter came from consumer discretionary, energy, and financials—all areas of the economy dependent on the reopening. The pace of the reopening appears to have caught analysts and corporate management teams by surprise.
Booming manufacturing activity. The Institute for Supply Management (ISM) Manufacturing Index hit a 37-year high near 65 during March. Manufacturing activity, which has historically correlated well with earnings, has come back stronger than most analysts had anticipated.
Tremendous efficiency. Companies have done an outstanding job of managing costs during the pandemic. Amid all the attention on inflation fears during earnings conference calls, corporate America is on track to produce its most profitable quarter ever recorded in terms of net profit margins for the S&P 500.
Strong credit environment. Financials delivered the second-biggest upside earnings surprise at 35% (behind consumer discretionary’s 75% blowout), bolstered by lower-than-expected credit losses and releases of loan loss reserves.
Rising commodity prices. Energy has delivered the biggest upside earnings surprise at 38%, while the materials sector is on track to grow earnings 64% year over year.
Weakening U.S. dollar. The U.S. dollar was about 6% lower in the first quarter of 2021 than in the year-ago quarter, which we estimate boosted S&P 500 earnings by about 2 percentage points overall.
All earnings data sourced from FactSet.
Outlook Keeps Getting Better
For us, the most important barometer of results is always guidance and the path of future estimates. The S&P 500’s 5.2% advance in April came as results started rolling in. One of the reasons we were optimistic about upside coming into first-quarter earnings season was the guidance ratio. During the first quarter, an unusually high 64% of S&P 500 companies that provided formal guidance pushed numbers higher. For the second quarter, that number is similarly strong at 63%. This level of optimism is rare—the five-year average guidance ratio is 35%. Positive guidance has pushed the consensus estimate for S&P 500 earnings per share in 2021 significantly higher, from $176 on March 31 to $187 as of May 6. Year to date, the 2021 earnings estimate has increased by $20 per share, or 12%, which perhaps—not coincidentally—is about what the S&P 500 Index has returned so far in 2021.
Updated Thoughts on 2021
On April 5, we raised our S&P 500 earnings per share (EPS) estimate for 2021 to a range of $175—$177.50 because of our improved economic outlook and additional fiscal stimulus. With FactSet consensus at $187 following the blowout first-quarter results and strong guidance, our earnings forecast looks too low. The macroeconomic environment suggests potential upside to consensus forecasts, but the COVID-19 surge in some countries around the world, particularly in India, introduces some risk. A pickup in inflation from upward pressures in wages, supply shortages, or higher commodity prices, could easily hamper further profit margin improvement. The same goes for potentially higher interest rates. Finally, analysts’ estimates should catch up to reality at some point, so perhaps that starts to happen in the second or third quarter. Weighing the macroeconomic and business tailwinds against these risks, we believe $187.50-$190 per share is a reasonable expectation for S&P 500 earnings in 2021.
Raising S&P 500 Fair Value Target
First-quarter earnings were truly remarkable. In fact, results and guidance were so good that we were left with little choice but to lift our earnings forecasts just a month after our last increase. The economic backdrop remains favorable, supported by vaccine distribution, the reopening, and massive stimulus. The stronger earnings growth has enabled stocks to grow into their valuations. As a result, we are raising our 2021 year-end S&P 500 fair value target range to 4,400 – 4,450, which is 4% above the May 7 close at the low end of the range. We acknowledge there are risks to that higher forecast, including COVID-19 spread outside the U.S., deficit spending, geopolitics, inflation, and tax increases. Though justified by low interest rates, stock valuations are elevated. After a nearly 90% rally off the March 2020 lows, the S&P 500 may be due for a pause. So, while our outlook for stocks remains positive, we believe returns over the balance of the year may be modest and come with more volatility. Read previous editions of Weekly Market Commentary on lpl.com at News & Media. Jeffrey Buchbinder, CFA, Equity Strategist, LPL Financial
Ryan Detrick, CMT, Chief Market Strategist, LPL Financial ______________________________________________________________________________________________ IMPORTANT DISCLOSURES This material is for general information only and is not intended to provide specific advice or recommendations for any individual. There is no assurance that the views or strategies discussed are suitable for all investors or will yield positive outcomes. Investing involves risks including possible loss of principal. Any economic forecasts set forth may not develop as predicted and are subject to change. References to markets, asset classes, and sectors are generally regarding the corresponding market index. Indexes are unmanaged statistical composites and cannot be invested into directly. Index performance is not indicative of the performance of any investment and do not reflect fees, expenses, or sales charges. All performance referenced is historical and is no guarantee of future results. Any company names noted herein are for educational purposes only and not an indication of trading intent or a solicitation of their products or services. LPL Financial doesn’t provide research on individual equities. All information is believed to be from reliable sources; however, LPL Financial makes no representation as to its completeness or accuracy. US Treasuries may be considered “safe haven” investments but do carry some degree of risk including interest rate, credit, and market risk. Bonds are subject to market and interest rate risk if sold prior to maturity. Bond values will decline as interest rates rise and bonds are subject to availability and change in price. The Standard & Poor’s 500 Index (S&P500) is a capitalization-weighted index of 500 stocks designed to measure performance of the broad domestic economy through changes in the aggregate market value of 500 stocks representing all major industries. The PE ratio (price-to-earnings ratio) is a measure of the price paid for a share relative to the annual net income or profit earned by the firm per share. It is a financial ratio used for valuation: a higher PE ratio means that investors are paying more for each unit of net income, so the stock is more expensive compared to one with lower PE ratio. Earnings per share (EPS) is the portion of a company’s profit allocated to each outstanding share of common stock. EPS serves as an indicator of a company’s profitability. Earnings per share is generally considered to be the single most important variable in determining a share’s price. It is also a major component used to calculate the price-to-earnings valuation ratio. All index data from FactSet. Please read the full Outlook 2021: Powering Forward publication for additional description and disclosure. This research material has been prepared by LPL Financial LLC. Securities and advisory services offered through LPL Financial (LPL), a registered investment advisor and broker-dealer (member FINRA/SIPC). Insurance products are offered through LPL or its licensed affiliates. To the extent you are receiving investment advice from a separately registered independent investment advisor that is not an LPL affiliate, please note LPL makes no representation with respect to such entity. Not Insured by FDIC/NCUA or Any Other Government Agency | Not Bank/Credit Union Guaranteed | Not Bank/Credit Union Deposits or Obligations | May Lose Value
RES-742650-0521 | For Public Use | Tracking # 1-05142065 (Exp. 05/22)

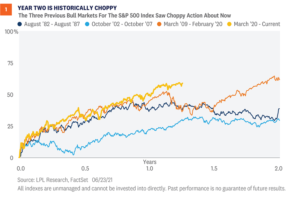

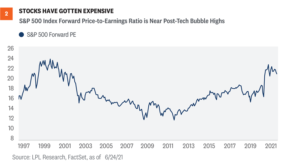
 To compare stock valuations to bond valuations, we can calculate an equity risk premium, or ERP. This statistic compares the earnings yield on the S&P 500 (the inverse of the P/E) to the 10-year U.S. Treasury yield. Essentially, an ERP compares the earnings generated by stocks to that generated by bonds. As of June 25, based on the consensus 2021 earnings estimate from FactSet, the S&P 500’s ERP is 3.1%. That compared with the long-term average ERP for the index of 0.8% (higher ERPs mean stocks are less expensive relative to bonds). So, while stock valuations look expensive, which could introduce above-average downside risk, they look quite reasonable when low interest rates are factored in.