“Sell in May and go away”1 is probably the most widely cited stock market cliché in history. Every year a barrage of Wall Street commentaries, media stories, and investor questions flood in about the popular stock market adage. We tackle this commonly cited seasonal pattern and why some seasonal weakness could make sense in 2021.
The Worst Six Months of the Year
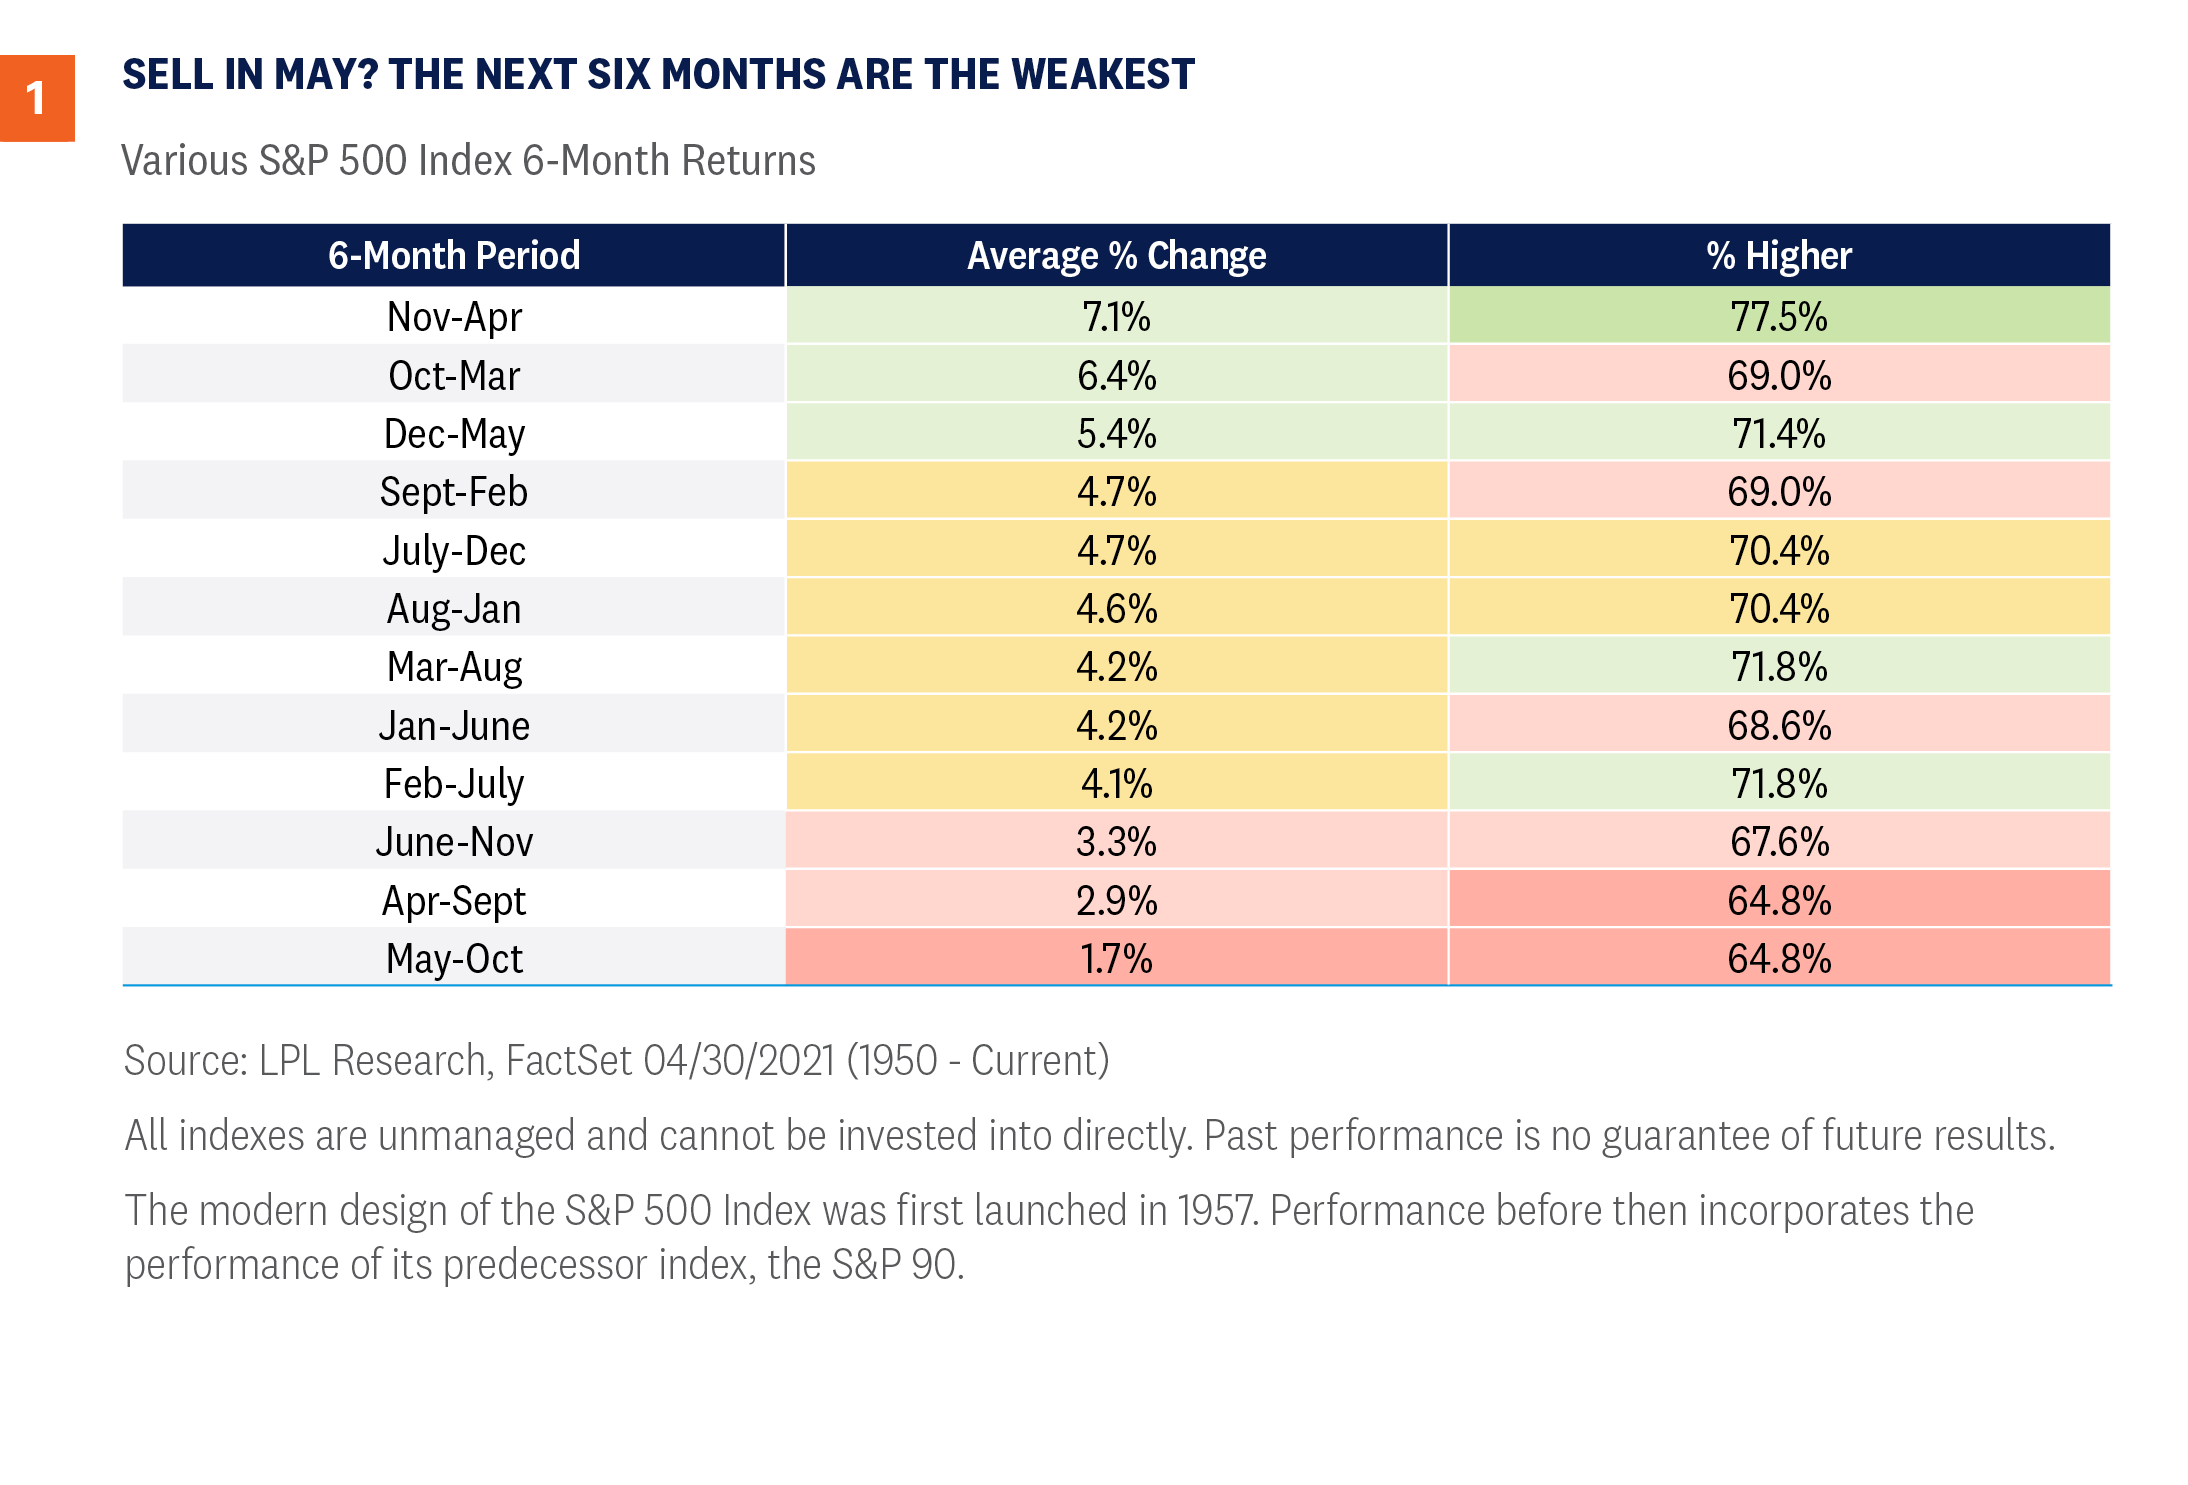
“Sell in May and go away” is the seasonal stock market pattern in which the six months from May through October are historically weak for stocks, with many investors believing that it’s better to avoid the market altogether by selling in May and moving to cash during the summer months. As [Figure 1] shows, since 1950 the S&P 500 Index has gained 1.7% on average during these six months, compared with 7.1% during the November to April period. In fact, out of all six-month combinations, the May through October period has produced the weakest—and least positive—average return. With the S&P 500 up 87% from the March 2020 lows, we do think the potential for some seasonal weakness is high and would be perfectly normal after such a run.
What Have You Done for Me Lately?
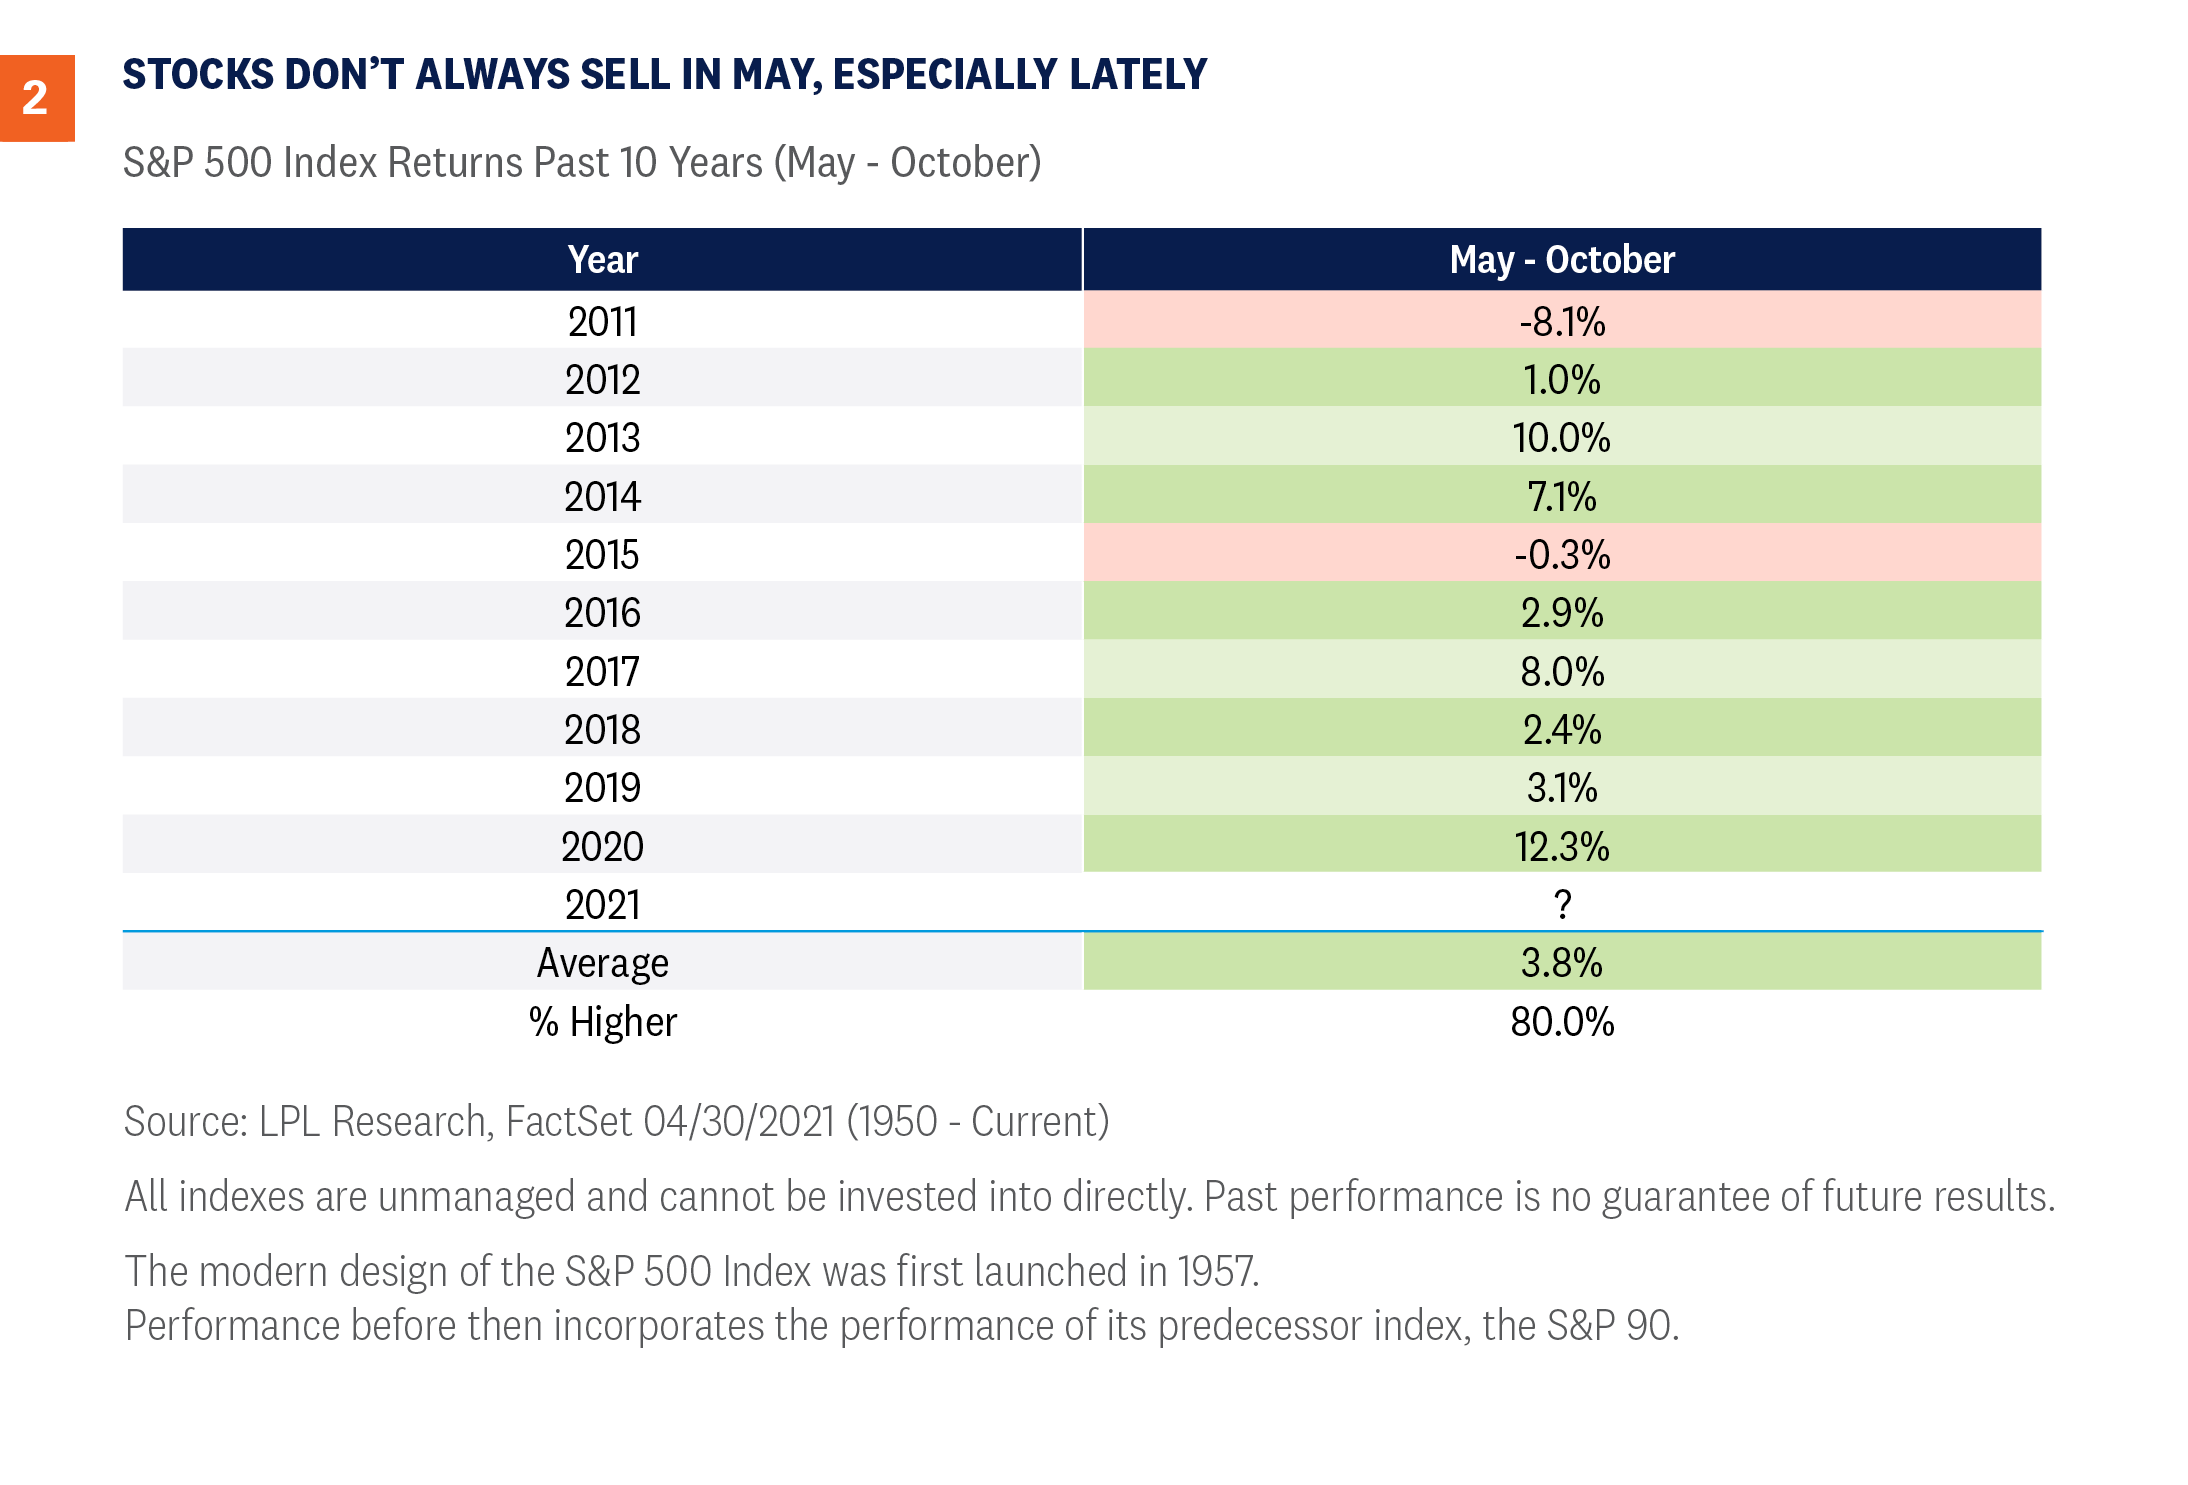
As we head into this seasonally weak period, keep a few things in mind. First, the S&P 500 has closed higher during the month of May in seven of the past eight years—so “Sell in June” might be more appropriate. In addition, stocks appear to get a boost in May of a post-election year, as the S&P 500 is up 1.7% on average these years, with only July and November stronger. The point is that investors shouldn’t necessarily blindly sell on May 1, but rather should be aware that volatility tends to happen in the summer and fall months. As we mentioned in our April 19, 2021 issue Peak Optimism?, we do see some signs that the bar is quite high now for further upside market catalysts. Everyone knows the reopening is happening, and everyone knows the economy is roaring back. From a contrarian point of view, this high bar could be tougher to clear as we move into the seasonally weaker summer and fall months. Here’s the catch—and there’s always a catch: These ‘worst six months of the year’ have been quite strong lately. In fact, stocks gained eight of the past 10 years during these six months, as you can see in [Figure 2]. So, although our guard is up for some potential seasonal weakness, be aware it could be short-lived, and we’d use it as a buying opportunity.
Four Other Looks at the Next Six Months
Let’s take a deeper dive into these ‘worst six months of the year’:
When April is up more than 5%, like it was this year, the next six months are up 6.2% on average—well above the 1.7% average during these six months.
Post-election years average 2.4% during these worst six months.
The best six months of the year just ended, and they gained nearly 28% this time around. It appears that big gains during these months can eat away at future returns. In fact, the next six months are up only 0.7% on average when the previous six months are up at least 20%.
When the S&P 500 closes at a new monthly high in April, like it did this year, the next six months do much better, up 5.6%.
Putting it all together, the only other year in history to close April at a new monthly high, be up at least 20% during the previous six months, and do it all in a post-election year was in 1961. What happened the next six months? The S&P 500 gained a very respectable 5.1%.
Conclusion
The media will have fun with the whole “Sell in May” warning to drive up clicks and views. Although you can’t argue that these months historically have been weak, they still sport a positive return, so totally going away isn’t wise. Recently we’ve been noting some potential reasons for at least a pause in the rally, and now the calendar adds another. But amid a backdrop of an improving economy, massive levels of fiscal and monetary stimulus, and rising vaccination rates, we don’t expect any pullbacks to last very long, and we’d use any that appear as a buying opportunity. While we upgraded our forecast for the global economy and U.S. corporate earnings last month, for now we are maintaining our fair value target range for the S&P 500 of 4,050–4,100. At the same time, we acknowledge the environment appears supportive for stocks to do better, and we continue to recommend an overweight-to-equities and underweight-to-fixed-income position relative to investors’ targets, as appropriate. Read previous editions of Weekly Market Commentary on lpl.com at News & Media. Jeffrey Buchbinder, CFA, Equity Strategist, LPL Financial
Ryan Detrick, CMT, Chief Market Strategist, LPL Financial 1 “Sell in May and go away” began in England originally as “sell in May and go away until St. Leger’s Day.” The saying was based around the St. Leger Stakes, a popular horse race in September that marked the end of summer and a return of the big traders and market volume. ______________________________________________________________________________________________ IMPORTANT DISCLOSURES This material is for general information only and is not intended to provide specific advice or recommendations for any individual. There is no assurance that the views or strategies discussed are suitable for all investors or will yield positive outcomes. Investing involves risks including possible loss of principal. Any economic forecasts set forth may not develop as predicted and are subject to change. References to markets, asset classes, and sectors are generally regarding the corresponding market index. Indexes are unmanaged statistical composites and cannot be invested into directly. Index performance is not indicative of the performance of any investment and do not reflect fees, expenses, or sales charges. All performance referenced is historical and is no guarantee of future results. Any company names noted herein are for educational purposes only and not an indication of trading intent or a solicitation of their products or services. LPL Financial doesn’t provide research on individual equities. All information is believed to be from reliable sources; however, LPL Financial makes no representation as to its completeness or accuracy. US Treasuries may be considered “safe haven” investments but do carry some degree of risk including interest rate, credit, and market risk. Bonds are subject to market and interest rate risk if sold prior to maturity. Bond values will decline as interest rates rise and bonds are subject to availability and change in price. The Standard & Poor’s 500 Index (S&P500) is a capitalization-weighted index of 500 stocks designed to measure performance of the broad domestic economy through changes in the aggregate market value of 500 stocks representing all major industries. The PE ratio (price-to-earnings ratio) is a measure of the price paid for a share relative to the annual net income or profit earned by the firm per share. It is a financial ratio used for valuation: a higher PE ratio means that investors are paying more for each unit of net income, so the stock is more expensive compared to one with lower PE ratio. Earnings per share (EPS) is the portion of a company’s profit allocated to each outstanding share of common stock. EPS serves as an indicator of a company’s profitability. Earnings per share is generally considered to be the single most important variable in determining a share’s price. It is also a major component used to calculate the price-to-earnings valuation ratio. All index data from FactSet. Please read the full Outlook 2021: Powering Forward publication for additional description and disclosure. This research material has been prepared by LPL Financial LLC. Securities and advisory services offered through LPL Financial (LPL), a registered investment advisor and broker-dealer (member FINRA/SIPC). Insurance products are offered through LPL or its licensed affiliates. To the extent you are receiving investment advice from a separately registered independent investment advisor that is not an LPL affiliate, please note LPL makes no representation with respect to such entity. Not Insured by FDIC/NCUA or Any Other Government Agency | Not Bank/Credit Union Guaranteed | Not Bank/Credit Union Deposits or Obligations | May Lose Value
RES-733201-0421 | For Public Use | Tracking # 1-05139454 (Exp. 05/22)
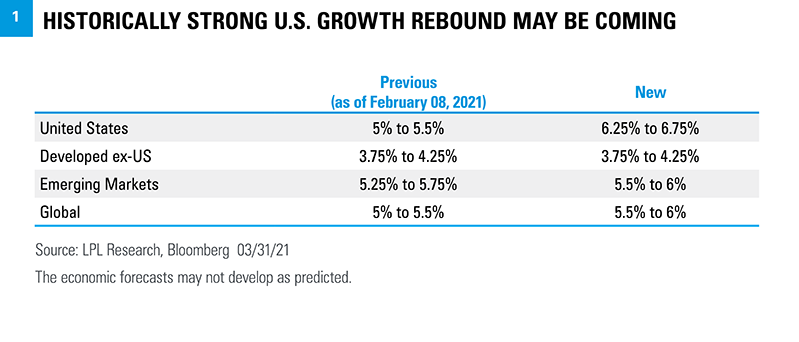
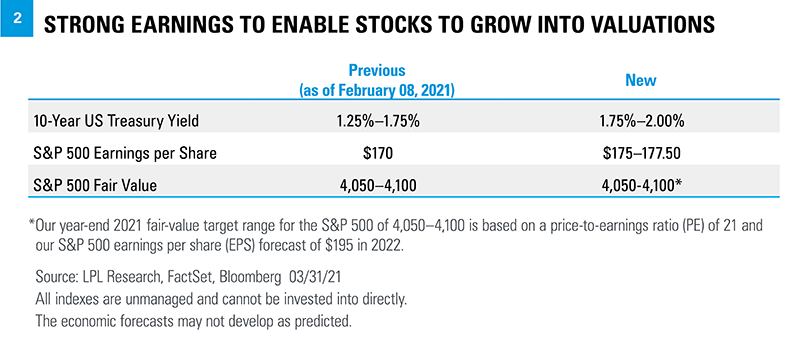
The U.S. economy’s recovery from the pandemic continues to surpass our expectations, aided by the accelerating vaccine distribution, massive stimulus, and America’s desire to resume some semblance of normal daily life. Despite having raised our 2021 economic and earnings growth forecasts on February 8, we are doing so again. We are also raising—and narrowing—our 10-year Treasury yield forecast range. Our S&P 500 Index target remains unchanged.
Vaccines + Reopening + Stimulus = Historic Growth
The rapid distribution of COVID-19 vaccines in the United States—now over 3 million shots per day—is bringing us closer to a fully reopened economy. That expected reopening, combined with a massive amount of fiscal stimulus has exceeded our earlier expectations, leaving economic growth forecasts overly pessimistic. Since the first vaccine candidate was approved in early December 2020, the United States has administered over 150 million doses and has fully vaccinated 16% of the total population, according to data from Johns Hopkins. Although cases have risen in some states in recent weeks, we expect vaccinations to win the race against COVID-19 variants this spring and facilitate the full reopening of the economy by June. The current pace of over 3 million shots per day puts herd immunity potentially within reach by early summer, when more than 70% of adults in the U.S. could potentially have the antibodies through vaccine or infection. In addition to the surge in economic activity that is accompanying the reopening, the federal government has passed $5 trillion in fiscal stimulus packages in 2020 and 2021 to fight COVID-19 and mitigate the pandemic’s economic impact. Most recently, President Biden signed a $1.9 trillion stimulus bill into law on March 11, 2021—the impact of which has barely been felt. Yet, more is on the way because a big infrastructure spending bill will likely be passed over the next four to six months—almost certainly without Republican votes. On March 31, 2021, President Joe Biden proposed spending $2.25 trillion on infrastructure over eight years, though the Democrats may not be able to get all of it done through the reconciliation process that requires only 50 votes in the Senate (plus the tie-breaking vote from Vice President Kamala Harris)—but comes with restrictions. While it is debatable whether this much additional government spending is prudent following the historic amount of debt-financed fiscal support put in place over the past year, there is no debating that some of that additional spending will boost economic growth (for those keeping score, the fiscal pandemic relief bill is already over 25% of GDP). In addition, we don’t expect the Federal Reserve (Fed) to do anything this year to slow the economic rebound. We believe the full reopening of the U.S. economy that we anticipate over the next several months, combined with the massive stimulus efforts and Fed support, has left our economic growth forecasts too low. As a result, we have raised our forecast for U.S. gross domestic product (GDP) growth in 2021 to 6.25—6.75%, up from our previous forecast of 5—5.5% [Figure 1]. At the same time, we have slightly increased our forecasts for emerging markets (EM) and global growth. Our developed ex-U.S. forecast remains unchanged, although ongoing COVID-19 spread and a slow vaccine rollout in continental Europe introduces some downside risk.
Raising our Earnings Forecast
With higher economic growth comes more revenue opportunities for corporate America, so we are also raising our S&P 500 earnings per share (EPS) forecast for 2021. Stronger global growth sets the stage for a potential substantial increase in revenue and profits in 2021. We have raised our estimate for S&P 500 earnings per share in 2021 to a range of $175–$177.50, which brackets consensus ($176, per FactSet) and represents a more than 25% increase over 2020 at the midpoint [Figure 2]. Given the impressive fourth-quarter earnings season, upward trending consensus estimates, and expected surge in growth, these higher estimates might end up being conservative. Look for more on earnings in our first-quarter earnings preview here next week.
Raising our Interest Rate Forecast
Coming into this year, we expected longer-maturity Treasury yields to rise, consistent with improving economic growth dynamics. That is indeed what we have seen, with the yield on the 10-year Treasury higher by 80 basis points (0.8%) year-to-date, and over 120 basis points (1.2%) since last year’s lows. What we did not expect—at least not until the Democrats won two Senate seats in Georgia—was an additional nearly $2 trillion fiscal stimulus package on top of the super-accommodative Federal Reserve. The stronger economic growth outlook, which is a key fundamental input into assessing Treasuries’ valuations, leads us to increase our year-end forecast for the 10-year Treasury yield to a range of 1.75% - 2.00%. We recognize that, in the short-term as inflation readings pick up, yields may eclipse 2.00%. However, we still believe there are structural headwinds to sustained, outsized inflation levels that should limit further sell-offs in Treasuries and bring yields back in-line with our fundamental assessment by year-end. While we are updating our year-end Treasury yield forecast, our preference for less interest-rate sensitive fixed income investments has not changed. Additionally, we still believe an underweight to fixed income relative to targets within a diversified asset allocation—makes sense.
Why Not Raise Our S&P 500 Target?
Our target for the S&P 500 Index is based on an earnings forecast and a price-to-earnings multiple (E times P/E = P). So, if we’re raising our earnings forecast, why not increase our S&P 500 target as well? Two reasons: First, we expect higher interest rates to lead to slightly higher valuations. And second, our S&P 500 target is based on our 2022 S&P 500 EPS forecast, which we are keeping at $195. Corporate tax increases are likely to be a drag on 2022 earnings, whether the rate goes from 21% to 25%, 28%, or somewhere in between. We reiterate our S&P 500 Index fair value target range of 4,050–4,100 at year-end 2021, based on a price-to-earnings (PE) multiple near 21 and our 2022 earnings forecast of $195, though we can envision a scenario where stocks do better. We continue to recommend an overweight to equities and underweight to fixed income relative to investors’ targets, as appropriate. Read previous editions of Weekly Market Commentary on lpl.com at News & Media. Ryan Detrick, CMT, Chief Market Strategist, LPL Financial
Jeffrey Buchbinder, CFA, Equity Strategist, LPL Financial
Lawrence Gillum, CFA, Fixed Income Strategist, LPL Financial ______________________________________________________________________________________________ IMPORTANT DISCLOSURES This material is for general information only and is not intended to provide specific advice or recommendations for any individual. There is no assurance that the views or strategies discussed are suitable for all investors or will yield positive outcomes. Investing involves risks including possible loss of principal. Any economic forecasts set forth may not develop as predicted and are subject to change. References to markets, asset classes, and sectors are generally regarding the corresponding market index. Indexes are unmanaged statistical composites and cannot be invested into directly. Index performance is not indicative of the performance of any investment and do not reflect fees, expenses, or sales charges. All performance referenced is historical and is no guarantee of future results. Any company names noted herein are for educational purposes only and not an indication of trading intent or a solicitation of their products or services. LPL Financial doesn’t provide research on individual equities. All information is believed to be from reliable sources; however, LPL Financial makes no representation as to its completeness or accuracy. US Treasuries may be considered “safe haven” investments but do carry some degree of risk including interest rate, credit, and market risk. Bonds are subject to market and interest rate risk if sold prior to maturity. Bond values will decline as interest rates rise and bonds are subject to availability and change in price. The Standard & Poor’s 500 Index (S&P500) is a capitalization-weighted index of 500 stocks designed to measure performance of the broad domestic economy through changes in the aggregate market value of 500 stocks representing all major industries. The PE ratio (price-to-earnings ratio) is a measure of the price paid for a share relative to the annual net income or profit earned by the firm per share. It is a financial ratio used for valuation: a higher PE ratio means that investors are paying more for each unit of net income, so the stock is more expensive compared to one with lower PE ratio. Earnings per share (EPS) is the portion of a company’s profit allocated to each outstanding share of common stock. EPS serves as an indicator of a company’s profitability. Earnings per share is generally considered to be the most important variable in determining a share’s price. It is also a major component used to calculate the price-to-earnings valuation ratio. All index data from FactSet. Please read the full Outlook 2021: Powering Forward publication for additional description and disclosure. This research material has been prepared by LPL Financial LLC. Securities and advisory services offered through LPL Financial (LPL), a registered investment advisor and broker-dealer (member FINRA/SIPC). Insurance products are offered through LPL or its licensed affiliates. To the extent you are receiving investment advice from a separately registered independent investment advisor that is not an LPL affiliate, please note LPL makes no representation with respect to such entity. Not Insured by FDIC/NCUA or Any Other Government Agency | Not Bank/Credit Union Guaranteed | Not Bank/Credit Union Deposits or Obligations | May Lose Value
RES-699261-0321 | For Public Use | Tracking # 1-05129380 (Exp. 04/22)
With the NCAA college basketball tournament getting underway this week, LPL Research is getting in the spirit with its own version of March Madness. Here we share our “Final Four Factors” for the stock market in 2021: Vaccines, Policy, Profits, and Rates. While we see several strong competitors in this field, we believe the likely winner of this tournament is clear, and it will push stocks higher over the balance of the year.
FACTOR #1: VACCINES
Perhaps the most important factor in assessing economic growth prospects The distribution of COVID-19 vaccines is bringing us closer to a fully reopened economy and is likely the most important factor in assessing economic growth prospects for 2021.Their importance to the outlook for the US economy and financial markets cannot be overstated. Since the approval of the first vaccine candidate in early December 2020, the United States has administered over 100 million doses and has fully vaccinated roughly 13% of the total population, according to data from Johns Hopkins. The current pace of over 2.4 million shots per day is expected to pick up soon as the Johnson & Johnson single-dose vaccine—granted emergency use approval on February 27—becomes more widely available. The vaccine is easier to store and transport The vaccine rollout and ongoing containment measures have helped quell the winter surge in cases. New daily cases have fallen from a peak near 300,000 on January 8 to an average of around 50,000 last week. The number of people hospitalized with COVID-19 in the United States has also plummeted. And currently approved vaccines appear to be effective against current variants of COVID-19, helping quell the risk of another wave of infections. Thanks in large part to the efficacy of the vaccines, we expect the economy to move closer to a full reopening over the next several months as the end of the pandemic approaches.
FACTOR #2: POLICY
Added stimulus provides a clear near-term benefit. But what about long-term risks? President Biden signed a nearly $1.9 trillion stimulus bill into law on March 11, 2021. This latest stimulus package comes on the heels of approximately $3.4 trillion in stimulus passed by former President Trump in 2020, the last a $900 billion bill signed into law on December 27. Markets generally cheer stimulus, at least in the short term, and we’ve seen a historic amount of debt-financed fiscal support in the past year. Markets are forward looking, suggesting much of the stimulus has likely largely been priced into markets. At the same time, stimulus helps protect against economic downside and could still contribute to an upside surprise in conjunction with vaccines. The Federal Reserve (Fed) is also continuing to provide monetary stimulus, both by keeping its policy interest rate near zero and through its bond purchase program to help contain longer-term interest rates. The Fed has signaled that they will be cautious about raising rates, the most recent Fed policy committee projection putting the first rate hike of the economic cycle in 2023. Well before that, the Fed may start to signal growing comfort with the trajectory of the economy by easing off bond purchases, possibly as soon as this year. While stimulus is likely to continue to support markets over the near term, the risks are longer term. A widely expected temporary rise in inflation would be manageable, but a structural change in inflation may roil markets. We believe the longer-term forces keeping inflation in check, such as demographics, globalization, and technology innovation, remain in play. High debt levels carry a financial cost, but the impact on growth is likely to be gradual over a long period of time.
FACTOR #3: PROFITS
Strong economic recovery sets the stage for substantial revenue and profit growth The economic recovery to date continues to surpass expectations, bolstered by massive stimulus, potentially setting the United States economy up to grow 6% or more in 2021. A strong economic recovery sets the stage for a potential substantial increase in revenue and profits over the next year. Against that strong economic backdrop, our estimate for S&P 500 Index earnings per share in 2021 is $170, which is below consensus estimates of $175 (source: FactSet), and may end up being conservative. Fourth-quarter earnings season was stellar—S&P 500 earnings grew 4% year over year when a near double-digit decline was anticipated at quarter-end. And estimates have increased nicely over the past couple of months—by about 5%—all of which solidify the positive earnings outlook. Strong earnings growth is a key part of the bull case for stocks, given valuations are elevated. As we noted in Outlook 2021: Powering Forward, we expect stocks to grow into their valuations this year and move higher as earnings rebound strongly from their lockdown and recession-driven collapse in 2020. S&P 500 earnings could end up growing 25% or more this year and by double digits in 2022, based on consensus estimates.
FACTOR #4: RATES
How quickly rates rise matters more than the level Long-term interest rates are rising as the economic outlook improves. More important than the level of interest rates is how quickly we get there. If interest rates move higher too quickly, there could be spillover to the economy and stocks. Interest rates play an important role in economic and business conditions as they influence rates on consumer and business loans as well as impact returns on many investments. This year, we’ve seen the yield on the 10-year Treasury increase by 60 basis points (0.6%) to 1.6%, a full percentage point above last year’s lows on March 9 that were matched on August 4. While we don’t believe yields at these levels necessitate a repricing of financial assets, a meaningful move higher from these levels may cause financial conditions to tighten. We continue to believe yields will move higher throughout the year with an upward projection of 1.75% (our year-end range for the 10-year rate remains 1.25% to 1.75% for now). If rates move too high too fast, we would expect the Fed to intervene to ensure rising rates don’t become too restrictive and disrupt equity markets or the real economy. Stock market performance during prior periods of rising rates is reassuring, as we discussed here last week. As the economy reopens and expectations for growth and inflation evolve, the level and trajectory of interest rates will continue to be top of mind for investors. AND THE WINNER IS…We’re giving the championship to the vaccines in a rout! The distribution of COVID-19 vaccines is bringing us closer to a fully reopened economy and is likely the most important factor in assessing economic growth prospects for 2021. Earnings and stimulus are strong competitors which we believe will help support stock market gains this year. We expect interest rates to fade as a threat to markets as the game plays out. We continue to recommend an overweight to equities and underweight to fixed income relative to investors’ targets, as appropriate. We reiterate our S&P 500 Index fair value target range of 4,050–4,100 at year-end 2021, based on a price-to-earnings (PE) multiple near 21 and our 2022 earnings forecast of $195. Read previous editions of Weekly Market Commentary on lpl.com at News & Media. Jeffrey Buchbinder, CFA, Equity Strategist, LPL Financial
Ryan Detrick, CMT, Chief Market Strategist, LPL Financial
Barry Gilbert, Ph.D., CFA, Asset Allocation Strategist, LPL Financial ______________________________________________________________________________________________ IMPORTANT DISCLOSURES This material is for general information only and is not intended to provide specific advice or recommendations for any individual. There is no assurance that the views or strategies discussed are suitable for all investors or will yield positive outcomes. Investing involves risks including possible loss of principal. Any economic forecasts set forth may not develop as predicted and are subject to change. References to markets, asset classes, and sectors are generally regarding the corresponding market index. Indexes are unmanaged statistical composites and cannot be invested into directly. Index performance is not indicative of the performance of any investment and do not reflect fees, expenses, or sales charges. All performance referenced is historical and is no guarantee of future results. Any company names noted herein are for educational purposes only and not an indication of trading intent or a solicitation of their products or services. LPL Financial doesn’t provide research on individual equities. All information is believed to be from reliable sources; however, LPL Financial makes no representation as to its completeness or accuracy. US Treasuries may be considered “safe haven” investments but do carry some degree of risk including interest rate, credit, and market risk. Bonds are subject to market and interest rate risk if sold prior to maturity. Bond values will decline as interest rates rise and bonds are subject to availability and change in price. The Standard & Poor’s 500 Index (S&P500) is a capitalization-weighted index of 500 stocks designed to measure performance of the broad domestic economy through changes in the aggregate market value of 500 stocks representing all major industries. The PE ratio (price-to-earnings ratio) is a measure of the price paid for a share relative to the annual net income or profit earned by the firm per share. It is a financial ratio used for valuation: a higher PE ratio means that investors are paying more for each unit of net income, so the stock is more expensive compared to one with lower PE ratio. Earnings per share (EPS) is the portion of a company’s profit allocated to each outstanding share of common stock. EPS serves as an indicator of a company’s profitability. Earnings per share is generally considered to be the most important variable in determining a share’s price. It is also a major component used to calculate the price-to-earnings valuation ratio. All index data from FactSet. Please read the full Outlook 2021: Powering Forward publication for additional description and disclosure. This research material has been prepared by LPL Financial LLC. Securities and advisory services offered through LPL Financial (LPL), a registered investment advisor and broker-dealer (member FINRA/SIPC). Insurance products are offered through LPL or its licensed affiliates. To the extent you are receiving investment advice from a separately registered independent investment advisor that is not an LPL affiliate, please note LPL makes no representation with respect to such entity. Not Insured by FDIC/NCUA or Any Other Government Agency | Not Bank/Credit Union Guaranteed | Not Bank/Credit Union Deposits or Obligations | May Lose Value
RES-679700-0321 | For Public Use | Tracking # 1-05121713 (Exp. 03/22)
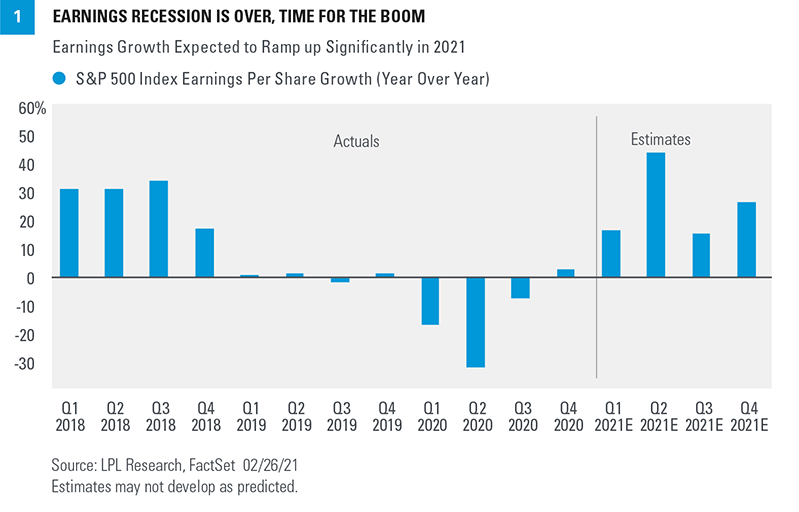
Fourth-quarter earnings season is in the home stretch, and it’s been a good one. After raising our 2021 earnings forecast for the S&P 500 Index in our Weekly Market Commentary on February 8, our upgraded forecast may now be too low, based on what we have learned from corporate America during the three weeks since. In this commentary, we recap earnings season and share our latest thoughts on just how strong the earnings rebound could be in 2021 and beyond.
Outstanding Numbers in the Fourth Quarter
Coming into fourth-quarter earnings season, investors had plenty of reasons to expect that companies would deliver better-than-expected results. The US economy grew at a solid 4% annualized pace in the fourth quarter (source: Bureau of Economic Analysis GDP data). Strong manufacturing surveys signaled better earnings ahead. Analysts’ earnings estimates rose during the quarter, as companies issuing fourth-quarter guidance mostly raised expectations. Now that all the numbers are pretty much in the books (93% of S&P 500 companies have reported results), it’s clear that optimism was warranted as earnings impressively grew during the quarter [Figure 1]. In our earnings preview on January 19, 2021, we wrote: Consider that the bar has been raised substantially over the past two quarters, making it tougher to clear. That probably takes positive earnings growth off the table, but a low-to-mid single-digit decline in earnings would be a positive outcome, especially if forward estimates hold up as fresh guidance is provided. After the bar had been raised, with the prior two quarters following similarly strong results compared to expectations, it made a lot of sense to expect more limited upside as estimates catch up to reality. But it turned out another quarter of huge upside—and earnings growth—was in the cards as corporate America again blew by expectations. S&P 500 companies delivered more earnings during the still-pandemic plagued Q4 2020 than in (pre-pandemic) Q4 2019. Here are the impressive numbers:
Fourth-quarter earnings growth for the S&P 500 is tracking to 3.5%, more than 12 percentage points above the consensus estimate at quarter-end (December 31, 2020).
A near-record 79% of S&P 500 companies have exceeded earnings estimates, above the five-year average of 74%.
Five sectors grew their earnings by double-digits: communication services, financials, healthcare, materials, and information technology.
Sales for S&P 500 companies in aggregate impressively rose more than 3% year over year.
During earnings season, the consensus earnings estimate for the next 12 months rose 4%, compared with the average 2-3% reduction historically.
All earnings data is sourced from FactSet These results were particularly impressive given the wave of COVID-19 that brought some new targeted restrictions late last year.
Bar Raised Again
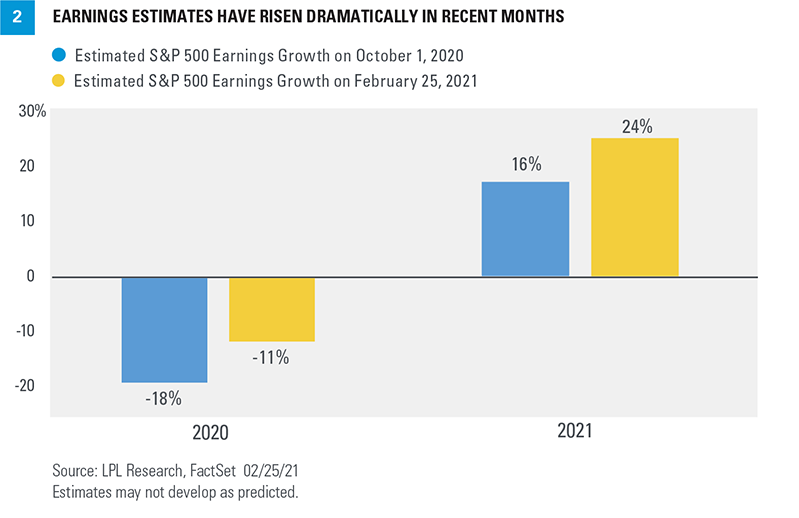
So, not only did corporate America deliver big upside to estimates—but their outlooks for 2021 were positive enough to drive a sizable increase in estimates. As shown in Figure 2, since the start of fourth quarter 2020 on October 1, 2020, estimates for 2020 and 2021 have increased significantly. These increases in estimates may be a sign of better earnings ahead. The economic recovery has continued to surpass expectations, based on solidly positive economic surprise indexes and our own expectations. More stimulus—a lot more—is likely coming soon, which could drive US GDP growth above our forecast of 5—5.5%. All of this suggests that our estimate for S&P 500 earnings this year of $170 per share could end up being conservative (analysts’ consensus estimate is up to $174). We see two risks to 2021 earnings. First, earnings tend to fall short of the consensus estimate in most years, though this year may be different given the unique circumstances. Second, COVID-19 still carries risks. We’d like to see further progress toward ending the pandemic first, but we see upside if all goes according to plan. Our 2022 forecast for S&P 500 earnings of $195 per share (raised from $190 on February 8) may be tougher to achieve because it does not include higher corporate taxes—which we see as likely next year (the consensus estimate stands at $200 per share). With stock valuations elevated, and corporate America not firing on all cylinders for a good chunk of 2021, earnings in 2022 take on greater importance. We expect stocks to deliver these strong earnings over the next 22 months and grow into their valuations, but it won’t be easy. Profits could potentially get a boost if wage increases are contained as the labor market tightens. Help could also come from a weaker US dollar (which boosts non-US profits through currency translation), stronger-than-expected international demand, and a possible reduction in tariffs.
Reiterating Positive Stock Market Outlook
Our confidence in the economic recovery continues to grow, bolstered by vaccine distribution, and fiscal and monetary stimulus. We anticipate a strong earnings rebound will enable stocks to grow into their elevated valuations, even if interest rates move a bit higher from here. Markets may still be underestimating the potential for pent-up demand to drive a sharp rebound in activity during the spring and summer as the economy fully reopens. COVID-19 still presents lingering near-term risk. Additional sharp and swift moves higher in interest rates could potentially cause valuations to contract meaningfully, though we see that as unlikely. So while a pickup in volatility would be normal at this stage of a strong bull market, we think suitable investors may want to consider buying this dip. We continue to recommend an overweight to equities and underweight to fixed income relative to investors’ targets, as appropriate. We reiterate our S&P 500 Index fair value target range of 4,050–4,100 at year-end 2021, based on a price-to-earnings (PE) multiple near 21 and our 2022 earnings forecast of $195. Read previous editions of Weekly Market Commentary on lpl.com at News & Media. Jeffrey Buchbinder, CFA, Equity Strategist, LPL Financial
Ryan Detrick, CMT, Chief Market Strategist, LPL Financial ______________________________________________________________________________________________ IMPORTANT DISCLOSURES This material is for general information only and is not intended to provide specific advice or recommendations for any individual. There is no assurance that the views or strategies discussed are suitable for all investors or will yield positive outcomes. Investing involves risks including possible loss of principal. Any economic forecasts set forth may not develop as predicted and are subject to change. References to markets, asset classes, and sectors are generally regarding the corresponding market index. Indexes are unmanaged statistical composites and cannot be invested into directly. Index performance is not indicative of the performance of any investment and do not reflect fees, expenses, or sales charges. All performance referenced is historical and is no guarantee of future results. Any company names noted herein are for educational purposes only and not an indication of trading intent or a solicitation of their products or services. LPL Financial doesn’t provide research on individual equities. All information is believed to be from reliable sources; however, LPL Financial makes no representation as to its completeness or accuracy. US Treasuries may be considered “safe haven” investments but do carry some degree of risk including interest rate, credit, and market risk. Bonds are subject to market and interest rate risk if sold prior to maturity. Bond values will decline as interest rates rise and bonds are subject to availability and change in price. The Standard & Poor’s 500 Index (S&P500) is a capitalization-weighted index of 500 stocks designed to measure performance of the broad domestic economy through changes in the aggregate market value of 500 stocks representing all major industries. The PE ratio (price-to-earnings ratio) is a measure of the price paid for a share relative to the annual net income or profit earned by the firm per share. It is a financial ratio used for valuation: a higher PE ratio means that investors are paying more for each unit of net income, so the stock is more expensive compared to one with lower PE ratio. Earnings per share (EPS) is the portion of a company’s profit allocated to each outstanding share of common stock. EPS serves as an indicator of a company’s profitability. Earnings per share is generally considered to be the single most important variable in determining a share’s price. It is also a major component used to calculate the price-to-earnings valuation ratio. All index data from FactSet. Please read the full Outlook 2021: Powering Forward publication for additional description and disclosure. This research material has been prepared by LPL Financial LLC. Securities and advisory services offered through LPL Financial (LPL), a registered investment advisor and broker-dealer (member FINRA/SIPC). Insurance products are offered through LPL or its licensed affiliates. To the extent you are receiving investment advice from a separately registered independent investment advisor that is not an LPL affiliate, please note LPL makes no representation with respect to such entity. Not Insured by FDIC/NCUA or Any Other Government Agency | Not Bank/Credit Union Guaranteed | Not Bank/Credit Union Deposits or Obligations | May Lose Value
RES-670100-0221 | For Public Use | Tracking # 1-05116224 (Exp. 03/22)
Last week we discussed whether stock prices might be reflecting peak optimism. In that commentary we noted that while sentiment may be overly optimistic and a pickup in volatility would be totally normal, strong breadth measures suggest stocks still may have more upside. This week we tackle that same topic of peak optimism, but by looking at some valuation metrics. While valuations are elevated, they still appear reasonable when factoring in interest rates and inflation.
Valuations Appear Elevated on Traditional Metrics
Based on the most commonly used valuation metrics such as the price-to-earnings ratio (P/E), stock market valuations are elevated. This is hardly a controversial statement when considering the S&P 500 Index is trading at a P/E of 22 times the consensus earnings estimate for the next 12 months (source: FactSet). Even against the 2022 consensus earnings estimate, which may be a better measure given the strong earnings growth anticipated this year and next, the P/E of 20 is still several points above the long-term average of 17 since 1980. By that measure, we would say a lot of good news is priced in.
Valuations Look Quite Reasonable When Factoring in Rates
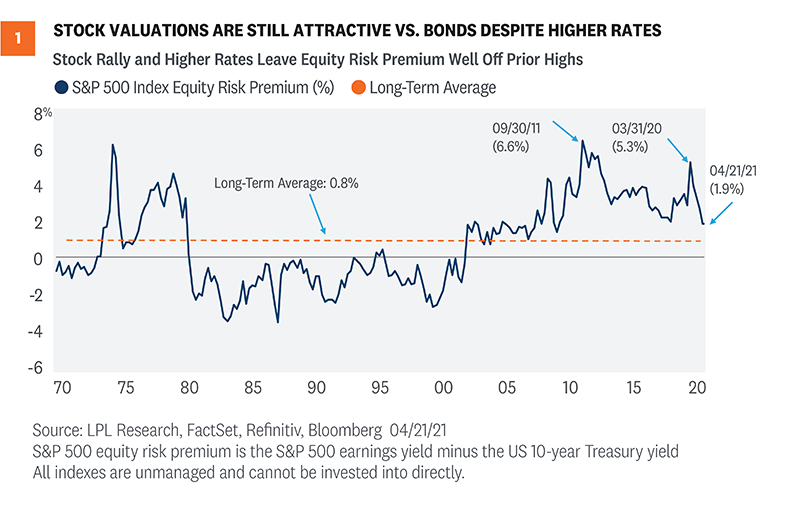
But we shouldn’t evaluate stock valuations in a vacuum. Going back to your Finance 101 days, the fundamental value of a stock is the present value of its future cash flows. When we discount future cash flows—a similar but purer measure of profits—interest rates come into play. That means we want to incorporate interest rate levels into our evaluation of P/E ratios. History shows higher interest rates have translated into lower stock valuations—and lower rates, our current situation, justify higher valuations. To get this fuller picture, we calculate what’s called an equity risk premium, or ERP. This statistic compares the earnings yield on the S&P 500 (the inverse of the P/E) to the 10-year US Treasury yield. Essentially, an ERP compares the earnings generated by stocks to the income generated by bonds (in this case, the yield on the 10-year Treasury). By putting stocks and bonds in the same terms, they can be compared on an apples-to-apples basis. As of April 21, 2021, the ERP for the S&P 500 Index was 1.9%, which is above the long-term average of 0.8% but well below the post-pandemic peak of 5.3% on March 31, 2020 [Figure 1]. (Higher values mean stocks are less expensive relative to bonds, and vice versa.) Using the earnings estimate for the next 12 months rather than the last 12 months pushes the ERP up to an even more compelling 3%. So, while we acknowledge stock valuations are elevated, compared to still-low interest rates they are quite reasonable.
Inflation is Also a Factor
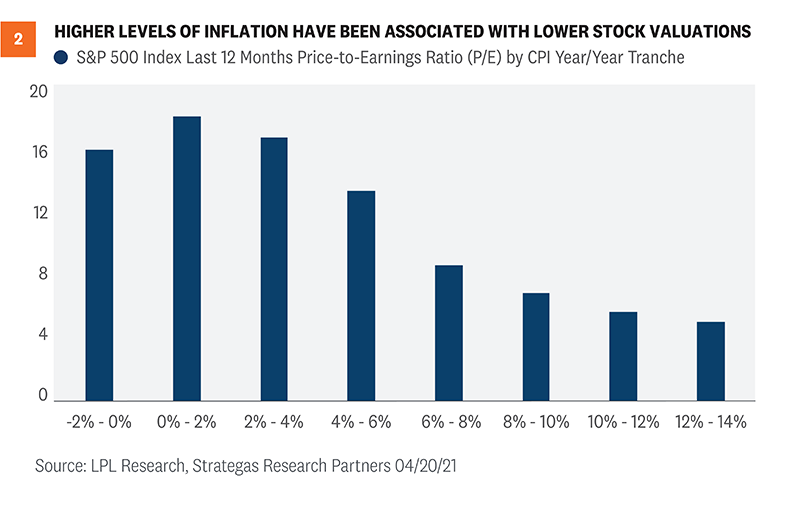
Stock valuations have also been impacted by inflation levels historically. This makes sense because higher inflation tends to bring higher interest rates along with it. In essence, higher inflation reduces the value of future profits and cash flows, and therefore leads to investors paying less for those profits and cash flows in the form of lower valuations. This relationship is shown in [Figure 2], where you can see that low inflation (2% or less, based on the consumer price index, or CPI) has historically coincided with the highest P/Es. While we expect inflation to move above 2% due to stronger economic growth, tightening labor markets, and the base effects associated with depressed price readings early in the pandemic, valuations have historically been above average in the 2% to 4% inflation tranche, which eases our concern. In addition, we would expect higher inflation to be temporary. So, after the pandemic is further in the rear view mirror and the readings normalize, valuations may garner some support. We discussed why higher inflation may be transitory here.
Other Valuation Considerations
We believe the aforementioned valuation metrics paint a relatively full picture, but there are several other considerations.
Watch cash flows. Getting a bit technical, cash flows matter more than earnings, which are an accounting measure that can be distorted. Free cash flow yield (cash flow left after capital investment versus price) is about 4.1% for the S&P 500 right now. That reading is higher, i.e., cheaper, than the average in the 1990s and not too much pricier than the 30-year average of 4.9%. But again, rates were higher during most of that 30-year period, which we believe supports lower free cash flow yields we are seeing in the current lower-rate environment. And cash flows remain depressed by the economic cycle, which inflates current valuations. We expect cash flow growth over the next 12 months will make stocks look even more attractive on this valuation metric.
Efficiency boom. The tech boom in recent decades has enabled companies to do more with less. Fewer employees and less capital equipment are needed to run many businesses today—particularly technology and internet businesses. That enhances return potential for tech-savvy operators, which shows up in higher returns on assets and higher returns on invested capital. For example, Amazon’s return on assets in 2020 was 7.8%, compared with 5.5% for Walmart. And Amazon’s return on invested capital last year was 14.1%, compared with Walmart’s 9.7%.
Tax rates matter. Dividend and capital gains tax rates combined averaged 42% during the 2010s, compared to 106% in the 1970s, 70% in the 1980s, and 63% in the 1990s. Higher tax rates impact investors’ expectations for after-tax returns, which we believe helps justify above-average stock valuations over the past two decades and currently. At the same time, the possibility that these tax rates increase next year, as President Biden has proposed, could cause valuations to narrow.
Valuations are not good short-term timing tools. Remember that in the short term, valuations are not good timing tools. Historically, there has been little relationship between price-to-earnings ratios and subsequent one-year returns. So, while we want to be mindful of valuations, they are only part of the picture. They have historically begun to become useful as timing tools when time horizons are extended to at least three years.
Conclusion
Stock valuations are elevated right now, and a lot of good news is priced in. However, we believe valuations are quite reasonable when considering interest rates are low and we expect inflation to remain largely contained. Investors are appropriately optimistic in our view, given the backdrop of a dramatically improving economy, the rapid pace of vaccinations in the U.S. that is facilitating the reopening, massive levels of fiscal and monetary stimulus, and surging earnings. We see further upside potential for stocks between now and the end of the year—although the pace of gains is likely to moderate relative to the 11% year-to-date advance for the S&P 500. We acknowledge our year-end fair value target range for the S&P 500 of 4,050–4,100 may prove to be conservative and are considering higher targets. We continue to recommend investors overweight equities and underweight fixed income relative to their targets, as appropriate. Read previous editions of Weekly Market Commentary on lpl.com at News & Media. Jeffrey Buchbinder, CFA, Equity Strategist, LPL Financial
Ryan Detrick, CMT, Chief Market Strategist, LPL Financial ______________________________________________________________________________________________ IMPORTANT DISCLOSURES This material is for general information only and is not intended to provide specific advice or recommendations for any individual. There is no assurance that the views or strategies discussed are suitable for all investors or will yield positive outcomes. Investing involves risks including possible loss of principal. Any economic forecasts set forth may not develop as predicted and are subject to change. References to markets, asset classes, and sectors are generally regarding the corresponding market index. Indexes are unmanaged statistical composites and cannot be invested into directly. Index performance is not indicative of the performance of any investment and do not reflect fees, expenses, or sales charges. All performance referenced is historical and is no guarantee of future results. Any company names noted herein are for educational purposes only and not an indication of trading intent or a solicitation of their products or services. LPL Financial doesn’t provide research on individual equities. All information is believed to be from reliable sources; however, LPL Financial makes no representation as to its completeness or accuracy. US Treasuries may be considered “safe haven” investments but do carry some degree of risk including interest rate, credit, and market risk. Bonds are subject to market and interest rate risk if sold prior to maturity. Bond values will decline as interest rates rise and bonds are subject to availability and change in price. The Standard & Poor’s 500 Index (S&P500) is a capitalization-weighted index of 500 stocks designed to measure performance of the broad domestic economy through changes in the aggregate market value of 500 stocks representing all major industries. The PE ratio (price-to-earnings ratio) is a measure of the price paid for a share relative to the annual net income or profit earned by the firm per share. It is a financial ratio used for valuation: a higher PE ratio means that investors are paying more for each unit of net income, so the stock is more expensive compared to one with lower PE ratio. Earnings per share (EPS) is the portion of a company’s profit allocated to each outstanding share of common stock. EPS serves as an indicator of a company’s profitability. Earnings per share is generally considered to be the single most important variable in determining a share’s price. It is also a major component used to calculate the price-to-earnings valuation ratio. All index data from FactSet. Please read the full Outlook 2021: Powering Forward publication for additional description and disclosure. This research material has been prepared by LPL Financial LLC. Securities and advisory services offered through LPL Financial (LPL), a registered investment advisor and broker-dealer (member FINRA/SIPC). Insurance products are offered through LPL or its licensed affiliates. To the extent you are receiving investment advice from a separately registered independent investment advisor that is not an LPL affiliate, please note LPL makes no representation with respect to such entity. Not Insured by FDIC/NCUA or Any Other Government Agency | Not Bank/Credit Union Guaranteed | Not Bank/Credit Union Deposits or Obligations | May Lose Value
RES-724207-0421 | For Public Use | Tracking # 1-05137262 (Exp. 04/22)
Developments in the economy and the fight against the virus are likely to provide the ingredients for a positive outlook through the remainder of the year.
Source: WEEKLY COMMENTARY
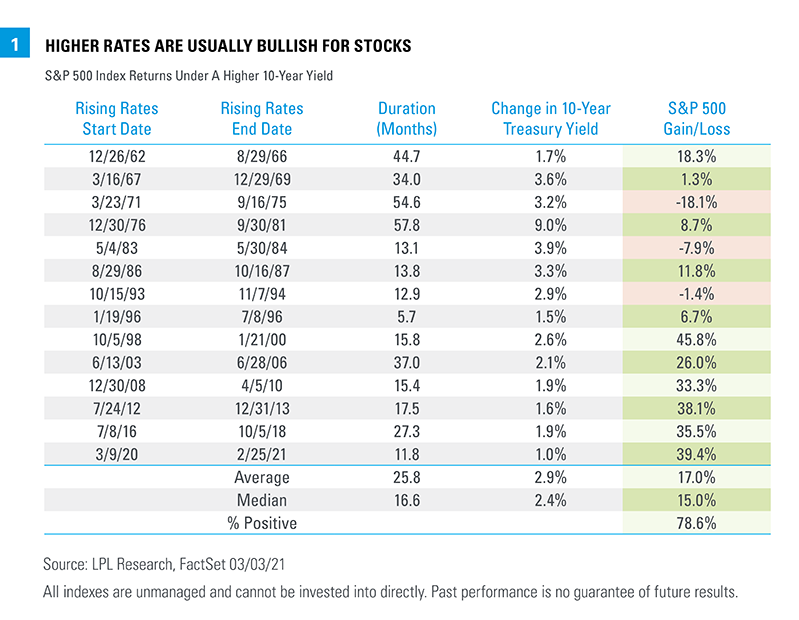
The 10-year Treasury yield continues to climb higher, but remains low by historical standards. Still, the size of the move since July 2020—and the more recent acceleration—has some market participants worried about the potential impact on stock markets if rates continue to rise. Historically, the S&P 500 Index has endured extended periods of rising rates well. If an improving growth outlook is part of what’s driving rates higher, it should also support corporate profits, creating a positive fundamental backdrop for stocks.
Rising Rates are Usually Bullish For Stocks
Bond yields have been on the move lately, but stock prices have also been rising. And while some market participants are expressing increased concern that rising bond yields may begin to weigh on stock returns, stocks have usually been resilient in rising rate environments. LPL Research looked at major extended periods of rising rates dating back to the early 1960s [Figure 1]. We found 13 periods in which the 10-year Treasury yield rose by at least 1.5%, a move the current increase hasn’t even reached yet. These rising-rate periods lasted between six months and almost five years, with the average a little over two years. In nearly 80% (10 of 13) of the prior periods, the S&P 500 Index posted gains as rates rose, as it has so far in the current rising-rate period. In fact, the average yearly gain for the index during the previous rising-rate periods, at 6.4%, is just a little lower than the historical average over the entire period of 7.1%, while rising rates have been particularly bullish for stocks since the mid-1990s. Not all rising-rate periods are the same, though, and we believe stocks may tolerate the current rising-rate period
Inflation Makes a Difference
How markets have performed during a rising-rate period has depended heavily on what’s going on in the economy, with inflation a leading consideration. Rising rates during periods of high inflation have generally resulted in lower stock returns, although the level at which inflation has become a headwind is well above what even most inflation hawks expect now. From 1968 to 1990, the Consumer Price Index (CPI) rose an average of 6.2% per year and was above 3.5% every year except three. Five of the rising rate periods in [Figure 1] took place at least partially during those inflationary years. The average annual return during those rising-rate periods was -0.4%. During all other rising-rate periods, the average annual return was 13.0%, well above the average for all returns since 1962. While inflation expectations are rising right now, CPI growth of even 2.5% at the end of the year would be an upside surprise based on the median estimate of Bloomberg-surveyed economists. For all the concerns about inflation, we are a long way from the ‘70s and ‘80s.
A Steepening Yield Curve Has Been a Good Sign
The yield curve is the difference between long-term and short-term interest rates. A steepening yield curve usually tells us two things: economic growth expectations are picking up, pushing long-term rates higher; and the Federal Reserve (Fed) probably is not yet pumping the brakes, helping to keep short-term rates relatively low, which usually also means inflation is under control. During the four rising-rate periods that saw the least yield curve steepening, as measured by the difference between 10-year and 3-month Treasury yields, S&P 500 Index returns were weaker than for a typical period, averaging an annualized 3.5%. In the four periods when the yield curve steepened the most, the S&P 500 averaged an annualized 14.5%. While yield curve steepening has not yet been dramatic enough to make its way into the top four periods historically, we have seen considerable steepening already. With the Fed likely on hold for some time, anchoring the short end of the curve, we expect that if rates continue to rise, it will come with further steepening. Some of that may be because of rising inflation expectations, but the main driver is likely to be an improved growth outlook.
The Starting Point Matters
Rates have been rising but they are still historically low, with the 10-year Treasury yield at the end of February falling into the bottom 2% of all values dating back to 1962. While it’s true that rates become a bigger burden for business, consumers, and governments as they rise, even at current and higher levels rates are still attractive and can continue to support a robust economic rebound. Looking back again at the different rising rate periods, during the four periods with the highest initial 10-year Treasury yield, the S&P 500 averaged a 2.5% annualized return, while those with the four lowest initial yields averaged 15.4%. A lower initial yield likely reflects manageable inflation and a Fed that isn’t tightening, but it also represents the added economic support of a still low cost of borrowing even as rates rise.
The Current Rising Rate Environment Looks Positive For Stocks
Rising interest rates have clearly been one of the reasons the S&P 500 has consolidated since hitting its last all-time high on February 12, but it’s important to look at the bigger picture. Rising rates in general have not prevented stocks from advancing and the current environment improves the odds that stocks will be able to continue to press higher. Rising rates are being driven in part by an improving growth outlook; inflation, while normalizing, is still well below levels that have historically disrupted markets; the Fed remains supportive; and borrowing costs are still historically quite low. Every market environment is unique, but taking our cues from history, the economic fundamentals continue to look strong and the current rising rate picture looks most similar to those periods of above-average stock performance. Read previous editions of Weekly Market Commentary on lpl.com at News & Media. Barry Gilbert, Ph.D., CFA, Asset Allocation Strategist, LPL Financial
Lawrence Gillum, CFA, Fixed income Strategist, LPL Financial ______________________________________________________________________________________________ IMPORTANT DISCLOSURES This material is for general information only and is not intended to provide specific advice or recommendations for any individual. There is no assurance that the views or strategies discussed are suitable for all investors or will yield positive outcomes. Investing involves risks including possible loss of principal. Any economic forecasts set forth may not develop as predicted and are subject to change. References to markets, asset classes, and sectors are generally regarding the corresponding market index. Indexes are unmanaged statistical composites and cannot be invested into directly. Index performance is not indicative of the performance of any investment and do not reflect fees, expenses, or sales charges. All performance referenced is historical and is no guarantee of future results. Any company names noted herein are for educational purposes only and not an indication of trading intent or a solicitation of their products or services. LPL Financial doesn’t provide research on individual equities. All information is believed to be from reliable sources; however, LPL Financial makes no representation as to its completeness or accuracy. US Treasuries may be considered “safe haven” investments but do carry some degree of risk including interest rate, credit, and market risk. Bonds are subject to market and interest rate risk if sold prior to maturity. Bond values will decline as interest rates rise and bonds are subject to availability and change in price. The Standard & Poor’s 500 Index (S&P500) is a capitalization-weighted index of 500 stocks designed to measure performance of the broad domestic economy through changes in the aggregate market value of 500 stocks representing all major industries. The PE ratio (price-to-earnings ratio) is a measure of the price paid for a share relative to the annual net income or profit earned by the firm per share. It is a financial ratio used for valuation: a higher PE ratio means that investors are paying more for each unit of net income, so the stock is more expensive compared to one with lower PE ratio. Earnings per share (EPS) is the portion of a company’s profit allocated to each outstanding share of common stock. EPS serves as an indicator of a company’s profitability. Earnings per share is generally considered to be the single most important variable in determining a share’s price. It is also a major component used to calculate the price-to-earnings valuation ratio. All index data from FactSet. Please read the full Outlook 2021: Powering Forward publication for additional description and disclosure. This research material has been prepared by LPL Financial LLC. Securities and advisory services offered through LPL Financial (LPL), a registered investment advisor and broker-dealer (member FINRA/SIPC). Insurance products are offered through LPL or its licensed affiliates. To the extent you are receiving investment advice from a separately registered independent investment advisor that is not an LPL affiliate, please note LPL makes no representation with respect to such entity. Not Insured by FDIC/NCUA or Any Other Government Agency | Not Bank/Credit Union Guaranteed | Not Bank/Credit Union Deposits or Obligations | May Lose Value
RES-674500-0321 | For Public Use | Tracking # 1-05119106 (Exp. 03/22)
Global stock markets are off to a strong start in 2021 as the world begins to emerge from the shadow of the COVID-19 pandemic. In the United States, vaccinations are increasing, the economy is expanding, unemployment is falling, and stimulus continues to flow through the economy. With the consensus crowding into an optimistic corner, many investors are wondering if sentiment may be running too hot.
Getting Better, Not Worse
Against a backdrop of historic fiscal and monetary stimulus, the global economy is emerging from the pandemic. With vaccination rates increasing—nearly 50% of the adult population in the U.S. have received at least one shot—and looser restrictions on activity, it is certainly understandable for investors to expect a rosy environment for stocks. The World Health Organization (WHO) declared COVID-19 a global pandemic a little over a year ago, and now a mere 15% of respondents to the recent Bank of America Global Fund Manager Survey view it as the largest tail risk. With the path forward ostensibly skewed to the upside, sentiment has become increasingly optimistic.
Sentiment A Near-Term Risk
The S&P 500 has rallied nearly 90% since its low on March 23, 2020, and is already up 10% in 2021 without so much as a 5% pullback on a closing basis. “Nothing changes sentiment like price” is an old saying, and 23 new all-time highs in 2021 (the most this early in any year since 1998) have made investors quite optimistic; however, excessive optimism can open the door for contrarian sellers to weigh on prices. When we upgraded our view on equities to overweight in late March 2020, one of the main reasons was the overriding sentiment backdrop of extreme pessimism that we felt limited the opportunity for further selling. This time around, many of our favorite sentiment gauges are becoming extremely bullish, which could be a near-term contrarian warning.
The American Association of Individual Investors Sentiment Survey recently showed bulls outnumber bears by the most since January 2018.
The 10- and 20-day average put/call ratios from the Chicago Board Options Exchange (CBOE) are above their 95th percentile—suggesting option markets are flashing a good deal of complacency. (Put options offer downside protection and express a negative view, while calls express a positive view by offering the right to buy.)
The Bank of America Global Fund Manager survey also showed that portfolio managers are maintaining significant underweights to cash, implying investors are all-in on the “risk on” environment.
Participation is Incredibly Strong
Sentiment isn’t the only warning sign we see near-term. The S&P 500’s 10% run from early March has the index at all-time highs, but has also pushed it to its most overbought status since early September, based on its 14-Day Relative Strength Index (RSI), a widely-used momentum measure. We believe the short-term, overbought conditions that we are experiencing now are a bullish indicator over the intermediate-term, as they show investor enthusiasm for equities. But in the near-term they can lead to more volatility, like we saw in September when the S&P 500 fell 9.9% before rallying nearly 12% in the fourth quarter. Another reason to be optimistic over the course of 2021 is that internals of the market are as strong as they have ever been. In fact, more than 95% of components in the S&P 500 Index are above their 200-day moving averages, a reading seen only two other times in the past 30 years [Figure 1]. Perhaps most importantly, those two other times were late 2003 and late 2009, near the beginning of major bull market runs—not the end. Overall, it would not surprise us to see some volatility over the coming months as markets digest these strong momentum surges. The previous two instances when we saw 95% of the components in the S&P 500 above their 200-day moving average in 2004 and 2010 opened the door to periods of consolidation and choppiness. In fact, 2010 saw as much as a 16% correction in the middle of the year before moving back to new highs before the end of the year. We’ve noted in the past that bull markets tend to catch their breath in year two, and we wouldn’t be surprised if we see a similar theme this year. However, as we enter the worst six-month period of the year, “Sell in May and go away,” we suggest using pullbacks opportunistically, and considering adding equities depending on objectives and risk tolerance.
Conclusion
We’ve come a long way and optimism is perfectly normal at this stage of the rally. Despite the frothy sentiment, strong internals continue to support our view that stocks could go higher from current levels. The backdrop of an improving economy, massive levels of fiscal and monetary stimulus, and rising vaccination rates provide further support to this view. While we upgraded our forecast for the global economy and U.S. corporate earnings earlier this month, for now we are maintaining our fair value target range for the S&P 500 of 4,050–4,100. At the same time, we acknowledge the environment appears supportive for stocks to do better, and we continue to recommend an overweight-to-equities and underweight-to-fixed-income position relative to investors’ targets, as appropriate. Read previous editions of Weekly Market Commentary on lpl.com at News & Media. Ryan Detrick, CMT, Chief Market Strategist, LPL Financial
Scott Brown, CMT, Senior Analyst, LPL Financial
Nick Pergakis, Analyst, LPL Financial ______________________________________________________________________________________________ IMPORTANT DISCLOSURES This material is for general information only and is not intended to provide specific advice or recommendations for any individual. There is no assurance that the views or strategies discussed are suitable for all investors or will yield positive outcomes. Investing involves risks including possible loss of principal. Any economic forecasts set forth may not develop as predicted and are subject to change. References to markets, asset classes, and sectors are generally regarding the corresponding market index. Indexes are unmanaged statistical composites and cannot be invested into directly. Index performance is not indicative of the performance of any investment and do not reflect fees, expenses, or sales charges. All performance referenced is historical and is no guarantee of future results. Any company names noted herein are for educational purposes only and not an indication of trading intent or a solicitation of their products or services. LPL Financial doesn’t provide research on individual equities. All information is believed to be from reliable sources; however, LPL Financial makes no representation as to its completeness or accuracy. US Treasuries may be considered “safe haven” investments but do carry some degree of risk including interest rate, credit, and market risk. Bonds are subject to market and interest rate risk if sold prior to maturity. Bond values will decline as interest rates rise and bonds are subject to availability and change in price. The Standard & Poor’s 500 Index (S&P500) is a capitalization-weighted index of 500 stocks designed to measure performance of the broad domestic economy through changes in the aggregate market value of 500 stocks representing all major industries. The PE ratio (price-to-earnings ratio) is a measure of the price paid for a share relative to the annual net income or profit earned by the firm per share. It is a financial ratio used for valuation: a higher PE ratio means that investors are paying more for each unit of net income, so the stock is more expensive compared to one with lower PE ratio. Earnings per share (EPS) is the portion of a company’s profit allocated to each outstanding share of common stock. EPS serves as an indicator of a company’s profitability. Earnings per share is generally considered to be the single most important variable in determining a share’s price. It is also a major component used to calculate the price-to-earnings valuation ratio. All index data from FactSet. Please read the full Outlook 2021: Powering Forward publication for additional description and disclosure. This research material has been prepared by LPL Financial LLC. Securities and advisory services offered through LPL Financial (LPL), a registered investment advisor and broker-dealer (member FINRA/SIPC). Insurance products are offered through LPL or its licensed affiliates. To the extent you are receiving investment advice from a separately registered independent investment advisor that is not an LPL affiliate, please note LPL makes no representation with respect to such entity. Not Insured by FDIC/NCUA or Any Other Government Agency | Not Bank/Credit Union Guaranteed | Not Bank/Credit Union Deposits or Obligations | May Lose Value
RES-705650-0421 | For Public Use | Tracking # 1-05134795 (Exp. 04/22)
There is a growing debate over whether an expanding economy, in conjunction with historic fiscal and monetary stimulus, may cause inflation to overheat. Adding to the intense debate, the Federal Reserve (Fed) has shifted its policy framework, potentially allowing inflation to run a little hotter than it has in the past. Despite vocal calls for runaway inflation, we believe that any uptick in inflation will ultimately prove transitory due to slack in the labor market and other structural forces.
What's Driving the Inflation Debate
Concerns over an inflation scare are rising as investors question whether an accelerating US economy supported by pent-up demand will overheat amid a backdrop of historic fiscal and monetary stimulus. With roughly $3 trillion worth of fiscal stimulus set to take effect in 2021 and a Federal Reserve (Fed) that has expressed its commitment to maintain extraordinary monetary support until its objective of maximum employment is achieved, the concerns are reasonable. Adding to inflation fears, the Fed’s strategy to allow inflation to modestly overshoot its 2% target raises the concern that it may end up scrambling to raise interest rates to control inflation—potentially tightening financial conditions in the process. While we do believe inflation may run hotter than it has in recent years, we believe worries of runaway inflation are overdone and that the upside risk for core inflation will be capped at around 3% for the full year in 2021—and likely will run meaningfully lower.
Near-Term Pressures Appear Well Contained
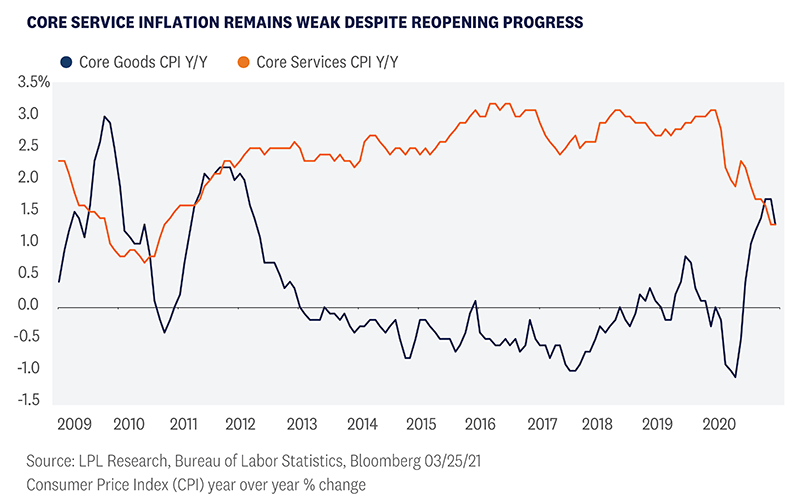
The US economy has come a long way, but it will take synchronized global growth before economic risks truly begin to abate, and this should limit inflationary pressure as well. Europe, Japan, and other regions have not been able to make the same progress on vaccination efforts, and mixed success in their prolonged battles against COVID-19 has led to slower economic activity relative to the US. We’ve also discussed how some areas of the economy have not participated in the recovery to the same degree, and the bifurcation between goods and services in the US is a perfect example. It’s no secret that service industries have borne the brunt of the economic impact of the pandemic, and this relationship is well illustrated by the changes in the core consumer price indexes (CPI) for goods and services [Figure 1]. Core service inflation comprises roughly 60% of the broader core CPI measure, so as long as services CPI remains subdued, it is difficult to imagine an environment of runaway inflation taking place. The unemployment rate is currently 6.3%, which should keep wage pressures from materializing in inflation. Further, labor force participation remains about 2% lower than pre-pandemic levels, suggesting the headline unemployment rate is understating the true level of unemployment in the economy. With considerable slack remaining in the US labor market, inflation should remain reasonably contained in the near term.
Structural Forces Affecting Long Term Inflation
We expect inflation to remain under control in 2021, but we also believe there are structural forces at play that have shifted the inflation regime since the environment of the late 20th century, when wages accounted for a larger portion of production costs. As labor’s share of production costs have declined, the Philips curve—the inverse relationship between unemployment and wage growth—has flattened, suggesting that lower levels of unemployment don’t correspond with the same degree of wage growth as in the past. Since the peak of 68% in 2001, labor’s share in private sector costs has declined to around 62%. With a lower share of production costs, businesses don’t have the same need to raise prices in response to a tightening labor market The most recent economic cycle exemplifies this flattening relationship. Prior to the pandemic, the unemployment rate in the US bottomed at 3.5%, yet the economy still fell short of the Fed’s inflation target of 2%. Looking at the workforce more broadly, populations are aging in developed economies, leading to slowing growth in the labor market. Despite strength in some areas of the economy, economic growth has been limited and the long-term growth outlook for developed market economies still looks muted. Technological advancements may also be creating headwinds for cost inflation. Advancements in communication technology have accelerated the trend toward globalization, helping contain both labor and material costs. Meanwhile, the expansion of e-commerce has improved price discovery for consumers—commonly referred to as the “Amazon effect.” These powerful forces are likely only to have a growing influence on the world economy that we believe should continue to help limit inflation.
Base Effects to Distort Data in Coming Months
The outbreak of COVID-19 in the spring of 2020 and the subsequent lockdowns created a massive demand shock to the global economy, triggering historic levels of deflation. March, April, and May each saw month-over-month declines in the CPI, with April registering the largest drop in history. As we move forward into these months, year-over-year CPI numbers will experience base effects that will distort the data, so our focus going forward will be on month-over-month increases until these distortions fully roll off.
Where Do We Go From Here?
Inflation concerns have grown as US Treasury yields have risen in recent weeks. Importantly, higher yields have been a combination of both rising inflation expectations and rising real yields, unlike late 2020 when inflation was the focus. The US economy is in a considerably better position than it was at this time last year, but slower economic progress in other regions of the world will continue to present risks to the recovery. Inflation is likely to increase as the economic recovery gathers steam, but we believe there are material headwinds to runaway inflation, both in the near term and the long term. Read previous editions of Weekly Market Commentary on lpl.com at News & Media. Barry Gilbert, PhD, CFA, Asset Allocation Strategist, LPL Financial
Nick Pergakis, Analyst, LPL Financial ______________________________________________________________________________________________ IMPORTANT DISCLOSURES This material is for general information only and is not intended to provide specific advice or recommendations for any individual. There is no assurance that the views or strategies discussed are suitable for all investors or will yield positive outcomes. Investing involves risks including possible loss of principal. Any economic forecasts set forth may not develop as predicted and are subject to change. References to markets, asset classes, and sectors are generally regarding the corresponding market index. Indexes are unmanaged statistical composites and cannot be invested into directly. Index performance is not indicative of the performance of any investment and do not reflect fees, expenses, or sales charges. All performance referenced is historical and is no guarantee of future results. Any company names noted herein are for educational purposes only and not an indication of trading intent or a solicitation of their products or services. LPL Financial doesn’t provide research on individual equities. All information is believed to be from reliable sources; however, LPL Financial makes no representation as to its completeness or accuracy. US Treasuries may be considered “safe haven” investments but do carry some degree of risk including interest rate, credit, and market risk. Bonds are subject to market and interest rate risk if sold prior to maturity. Bond values will decline as interest rates rise and bonds are subject to availability and change in price. The Standard & Poor’s 500 Index (S&P500) is a capitalization-weighted index of 500 stocks designed to measure performance of the broad domestic economy through changes in the aggregate market value of 500 stocks representing all major industries. The PE ratio (price-to-earnings ratio) is a measure of the price paid for a share relative to the annual net income or profit earned by the firm per share. It is a financial ratio used for valuation: a higher PE ratio means that investors are paying more for each unit of net income, so the stock is more expensive compared to one with lower PE ratio. Earnings per share (EPS) is the portion of a company’s profit allocated to each outstanding share of common stock. EPS serves as an indicator of a company’s profitability. Earnings per share is generally considered to be the single most important variable in determining a share’s price. It is also a major component used to calculate the price-to-earnings valuation ratio. All index data from FactSet. Please read the full Outlook 2021: Powering Forward publication for additional description and disclosure. This research material has been prepared by LPL Financial LLC. Securities and advisory services offered through LPL Financial (LPL), a registered investment advisor and broker-dealer (member FINRA/SIPC). Insurance products are offered through LPL or its licensed affiliates. To the extent you are receiving investment advice from a separately registered independent investment advisor that is not an LPL affiliate, please note LPL makes no representation with respect to such entity. Not Insured by FDIC/NCUA or Any Other Government Agency | Not Bank/Credit Union Guaranteed | Not Bank/Credit Union Deposits or Obligations | May Lose Value
RES-691144-0321 | For Public Use | Tracking # 1-05125894 (Exp. 03/22)